Categoría: Finance, Business, Management, Economics and Accounting
ORIGINAL
Utilizing Machine Learning and Deep Learning for Predicting Crypto-currency Trends
Utilización del aprendizaje automático y el aprendizaje profundo para predecir las tendencias de las criptomonedas
Ahmed El Youssefi1 ![]() *, Abdelaaziz Hessane1
*, Abdelaaziz Hessane1 ![]() *, Imad Zeroual1
*, Imad Zeroual1 ![]() *, Yousef Farhaoui1
*, Yousef Farhaoui1 ![]() *
*
1STI laboratory, T-IDMS, Faculty of Sciences and Techniques of Errachidia, Moulay Ismail University of Meknès. Morocco.
Cite as: Youssefi AE, Hessane A, Zeroual I, Farhaoui Y. Utilizing Machine Learning and Deep Learning for Predicting Crypto-currency Trends. Salud, Ciencia y Tecnología - Serie de Conferencias 2024; 3:638. https://doi.org/10.56294/sctconf2024638.
Submitted: 20-12-2023 Revised: 13-02-2024 Accepted: 10-03-2024 Published: 11-03-2024
Editor: Dr.
William Castillo-González ![]()
ABSTRACT
In the dynamic and often volatile world of the cryptocurrency market, accurately predicting future market movements is crucial for making informed trading decisions. While manual trading involves traders making subjective judgments based on market observations, the development of algorithmic trading systems, incorporating Machine Learning and Deep Learning, has introduced a more systematic approach to trading. These systems often employ technical analysis and machine learning techniques to analyze historical price data and generate trading signals. This study delves into a comparative analysis of two charting techniques, Heikin-Ashi and alternate candlestick patterns, in the context of forecasting single-step future price movements of cryptocurrency pairs. Utilizing a range of time windows (1 day, 12 hours, 8 hours, ..., 5 minutes) and various regression algorithms (Huber regressor, k-nearest neighbors regressor, Light Gradient Boosting Machine, linear regression, and random forest regressor), the study evaluates the effectiveness of each technique in forecasting future price movements. The primary outcomes of the research indicate that the application of ensemble learning methods to the alternate candlestick patterns consistently surpasses the performance of Heikin-Ashi candlesticks across all examined time windows. This suggests that alternate candlestick patterns provide more reliable information for predicting short-term price movements. Additionally, the study highlights the varying behavior of Heikin-Ashi candlesticks over different time windows.
Keywords: Technical Analysis; Machine Learning; Deep Learning; Charting Techniques; Cryptocurrency Price Forecasting; Heikin-Ashi Candlesticks.
RESUMEN
En el dinámico y a menudo volátil mundo del mercado de criptomonedas, predecir con precisión los futuros movimientos del mercado es crucial para tomar decisiones de trading informadas. Mientras que la negociación manual implica que los operadores realicen juicios subjetivos basados en observaciones del mercado, el desarrollo de sistemas de negociación algorítmica, que incorporan Machine Learning y Deep Learning, ha introducido un enfoque más sistemático de la negociación. Estos sistemas suelen emplear técnicas de análisis técnico y aprendizaje automático para analizar datos históricos de precios y generar señales de trading. Este estudio profundiza en un análisis comparativo de dos técnicas de gráficos, Heikin-Ashi y patrones de velas alternativos, en el contexto de la previsión de movimientos de precios futuros de un solo paso de pares de criptodivisas. Utilizando una serie de ventanas temporales (1 día, 12 horas, 8 horas, ..., 5 minutos) y varios algoritmos de regresión (Huber regressor, k-nearest neighbors regressor, Light Gradient Boosting Machine, linear regression y random forest regressor), el estudio evalúa la eficacia de cada técnica en la previsión de futuros movimientos de precios. Los principales resultados de la investigación indican que la aplicación de métodos de aprendizaje conjunto a los patrones de velas alternativas supera sistemáticamente el rendimiento de las velas Heikin-Ashi en todas las ventanas temporales examinadas. Esto sugiere que los patrones de velas alternas proporcionan información más fiable para predecir los movimientos de los precios a corto plazo. Además, el estudio destaca el comportamiento variable de las velas Heikin-Ashi en las distintas ventanas temporales.
Palabras clave: Análisis Técnico; Aprendizaje Automático; Aprendizaje Profundo; Técnicas Gráficas; Predicción de Precios de Criptomonedas; Velas Heikin-Ashi.
INTRODUCTION
The high volatility of the cryptocurrency(1) promises big returns on investments and exposes traders to high losses if their trading decisions are wrong. The decisions for a trader to make, while trading on an asset are buying, selling or holding (hodling in the cryptocurrency and blockchain communit.(2,3) These decisions depend on their estimation about how the market will behave in the future. To trade cryptocurrencies, traders use centralized and decentralized exchanges. Centralized exchanges (CEX) function as the predominant platform for the trading of tokens and cryptocurrencies involving various tradable pairs. Within cryptocurrency markets, centralized exchanges (CEXs) integrate infrastructures reminiscent of traditional equities markets, encompassing analogous protocols and rules for trade execution. These aligned features collectively contribute to the facilitation of liquidity provision and the initiation of the price discovery process within these exchange platforms.(4) Decentralized exchanges (DEXs) are an alternative market structure for traders of crypto assets, relying on smart-contract implementations of automated market makers (AMM). This framework facilitates on-chain trading, offering a distinct approach to crypto asset transactions.(5) CEXs offers different markets to trade on. Within this study we will be limited to the spot market. In the spot market, traders engage in instant exchanges of assets (tradable pairs). Transactions within the spot market (Referred to as spot trading) are settled immediately, with sellers specifying an ask price, and buyers indicating a bid price. This dynamic market is characterized by real-time exchanges and the interaction of buyers and sellers through order books managed by the CEX.
forecasting the trend of cryptocurrencies' price is a challenging task. traders use a variety of techniques, including technical analysis, fundamental analysis, and machine learning.
Technical analysis, which is commonly employed in forecasting cryptocurrency market trends, is founded on the premise that historical pricing movements and patterns can be utilized to anticipate future trends. It provides objective and data-driven insights into market trends by using technical indicators,(6) trading rules such as the trading range break-out which is based on support and resistance levels,(7) and chart patterns,(8) traders can make decisions regarding selling, hodling or buying a given cryptocurrency. In technical analysis, technical indicators are calculated from the historical price and other transactions data of a cryptocurrency, or a list of aggregated values over a given time window such as Japanese candlestick (referenced to as OHLC values for Open, High, Low and Close) or Heikin-Ashi candlesticks.
Fundamental analysis is an approach to valuing assets by examining their intrinsic worth.(9) When it comes to forecasting the value of cryptocurrencies, fundamental analysis entails evaluating the underlying elements that power a given coin or cryptocurrency, such as the blockchain technology it relies on and forthcoming project events (such as partnerships, a halving event, the introduction of a new consensus algorithm, etc.). the rate at which the project's services are adopted, the updates the project team delivers, and other project-related details. Fundamental analysts can make well-informed predictions regarding the future price of the coin by examining these variables. However, fundamental analysis can be challenging to apply to cryptocurrencies, due to the high volatility of the cryptocurrency market(10) and can be influenced by factors that are hard to forecast, such as sentiment and speculation.(11)
Machine learning algorithms have emerged as a promising tool for building cryptocurrency forecasting models (8). These algorithms can analyze vast volumes of data to find trends and connections that could indicate future changes in price. Machine learning algorithms use historical price data aggregated over a period to train models on forecasting a single step or multiple steps values of the price of cryptocurrencies into the future. Datasets used to train these models are mainly OHLC data collected directly from exchanges historical data archives or from sources that aggregate them from different exchanges and sources. The forecasting of future price movements of a cryptocurrency could be treated as a classification or a regression problem. Classification of future price uses a labeled dataset generated from the ohlc data combined with different types of features such as in.(12) Regression analysis of cryptocurrencies uses regression algorithms to forecast the values of cryptocurrency prices in a specific horizon
Both Heikin-Ashi and Japanese candlesticks are charting techniques used to visualize price changes of an asset, but they can be considered as aggregation techniques, since they are aggregating the prices data over a given time window. The resulting data can be used to forecast future market trends of a cryptocurrency. But which one is better? Japanese candlesticks or Heikin-Ashi? and using which time window? Therefore, we are suggesting that we conduct a comparison of these two techniques as a regression problem using different machine learning algorithms. and over different time windows. To the best of our knowledge no other study has made such a comparison of the two techniques. hence the novelty and the contribution of this work.
The rest of this paper is structured as follows, related works as the second section where we will present some of the recent works related to the use of Japanese and Heikin-Ashi candlesticks using different time windows. The third section will detail the process of data collection and preprocessing alongside with the main concepts and formulas related to it. The fourth section will present the results and discuss the main findings. the final section will conclude this paper and present perspectives of future works related to the theme of this study.
Related works
Several studies have investigated the use of regression algorithms, Japanese candlesticks and Heikin-Ashi for cryptocurrency and stocks price forecasting. Shakri et al. (13) investigated the effectiveness of various data-driven machine learning (ML) techniques for forecasting bitcoin returns time series data. The data used for forecasting included a comprehensive set of economic and financial indicators as predictors. To evaluate the performance of each ML technique, five statistical indexes were calculated: correlation coefficient, mean absolute error, root mean square error, relative absolute error, and root relative squared error. The results revealed that the Random Forest model outperformed the other ML techniques in terms of predictive accuracy. Mahayana et al. (14) proposes a machine learning-based system for cryptocurrency trading, employing the Cross Industry Standard Process for Data Mining (CRISP-DM) methodology and the Light Gradient Boosting Machine (LGBM) algorithm to forecast the price movement of the BTCUSDT cryptocurrency pair. The proposed system utilizes technical indicators and feature engineering to enhance the predictive accuracy of the LGBM model. While the model outperforms Logistic Regression, its performance still falls short of consistently exceeding the ROI of the Buy and Hold strategy, indicating the difficulty of consistently generating profit in cryptocurrency trading through machine learning approaches. Lahmiri et al. (15) presents a comparative evaluation of various AI systems for forecasting high-frequency bitcoin price series. They employed three distinct sets of models: statistical ML approaches, algorithmic models, and artificial neural network. The authors used Bayesian optimization to determine the optimal parameters values for support vector regressions (SVR) and Gaussian Poisson regressions, and kNN. The results of this study demonstrate that bayesian regularization artificial networks forecasting accuracy and convergence are better than the other used algorithms.
Heikin-Ashi candlesticks are used in literature for different purposes. Madbouly et al. (16) introduces a method for forecasting stock prices by integrating cloud models, fuzzy time series, and Heikin-Ashi candlesticks. The devised model tackles the complexities of nonlinearity, uncertainty, and noise inherent in stock market trends. Leveraging cloud models, it adeptly manages the ambiguity and uncertainty associated with both qualitative (Japanese candlestick patterns) and quantitative (actual stock prices) data. Fuzzy time series captures the dynamic nature of stock prices, incorporating fuzzy logic to represent linguistic concepts. Additionally, Heikin-Ashi candlesticks were employed to filter out stock noise, emphasizing the directional trends in the market. Piasecki et al. (17) consider Heikin-Ashi candlesticks as a variation of Japanese candlesticks that provide a smoother representation of price trends by incorporating elements of both past and present price movements. This transformation can be mathematically represented using oriented fuzzy numbers, which capture the uncertainty inherent in price data. While Heikin-Ashi candlesticks may introduce more imprecision than traditional Japanese candlesticks due to their averaging methodology, they can be effective for identifying trends in noisy price data. The model is evaluated using imperial evaluation and found to have high forecasting accuracy, making it feasible for practical implementation. The use Heikin-Ashi candlesticks isn’t limited to regression problems,
El Youssefi et al. (18) employ the K-Means clustering algorithm to categorize Heikin-Ashi candlesticks and logarithmic returns. The study explores the determination of the optimal number of classes for logarithmic returns associated with four specific cryptocurrencies, extracted from historical spot trading data archived by Binance. The outcomes reveal that the most suitable k-values for the analyzed cryptocurrencies fall within the range of three to five. These findings underscore the significance of clustering as a preprocessing step for classification when addressing the forecasting of cryptocurrency logarithmic returns. This approach proves more beneficial than utilizing a predefined set of classes that represent uptrends, downtrends, and no change in logarithmic returns.
Different time windows for cryptocurrency forecasting are used in different reported studies, To investigate the effectiveness of various machine learning algorithms in forecasting price movements for bitcoin. Akyildirim et al.(19) evaluated the relative forecasting performance of kNN, naïve bayes, logistic regression, random forest, support vector machine and extreme gradient boosting classifiers, across a range of time windows, spanning from 5 to 60 minutes. the findings reveal that the kNN and Random Forest algorithms consistently outperformed other methods in forecasting the value of the target variable across a range of time windows. And Cohen G et al. (20) employed commonly used oscillators, namely RSI, MACD, and Keltner Channels, to develop algorithmic trading systems for five popular cryptocurrencies: bitcoin, Ethereum, Binance Coin, Cardano, and XRP. Intraday price data with varying time frames ranging from 5 to 180 minutes is utilized to evaluate the performance of each trading system. The results indicate that longer time frames (60 and 120 minutes) yield superior trading results compared to shorter time frames (5 and 15 minutes).
METHODS
Data Collection and preprocessing
Binance(21) offer spot market archived historical data of all the trading pairs it has listed within their exchange for download. To forecast bitcoin price, we downloaded the historical data of the bitcoin/USDT trading pair, aggregated as a 1-minute time window for the period from 2017-08-01 to 2023-06-30, the data have been then aggregated to the following time windows: 5mins, 10mins, 15mins, 30mins, 1hour, 2h, 4h, 8h, 12h and 1day). These time windows will be the one we will use in our study.
To understand how this data is generated at the exchange level and how it is aggregated, we will present five main concepts: Exchange tick interval, aggregation time window, Japanese candlesticks, Heikin-Ashi candlesticks and logarithmic returns of price.
Exchange tick interval
Tick interval is the difference in time between two consecutive market updates streamlined by an exchange. For instance, Binance, one of the largest exchanges globally, operates with a tick interval of one second. This implies that every second, Binance sends updates to the current price of a cryptocurrency to reflect its value on their exchange. It is important to note that the tick interval is different from the tick size of a cryptocurrency, the latter means the minimum value a price of an asset can go up or down.
Aggregation time window
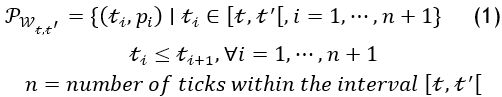
An aggregation time window W(t,t^') of size equal to t-t^', is a specific time interval, in terms of seconds, minutes, hours, days or more for which prices are updated. Each aggregation time window W(t,t^' )has n data points ti , where ti is the ith tick. For each ti corresponds a Pi the price at the ith tick. The value of n depends on the tick interval of an exchange. For example, if a cryptocurrency price is being monitored over Binance exchange, each aggregation time window of 1 minute will have an n= 60, which means that within a minute 60 price updates will take place.
The prices of a cryptocurrency over an aggregation time window W_(t,t^' ) could be defined by the following formula:
Japanese Candlesticks
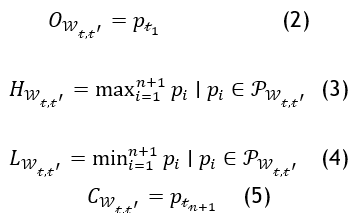
Japanese candlesticks represent a charting method utilized for visualizing the price fluctuations of an asset throughout its historical movement. Each candlestick consists of a rectangular body and two wick-like extensions, known as shadows. The body of the candlestick represents the difference between the closing price C_(W_(t,t^' ) ) (price at the last tick) and the opening price O_(W_(t,t^' ) ) (price at the first tick) for the considered aggregation time window W_(t,t^' ). The shadows represent the highest H_(W_(t,t^' ) ) and lowest prices L_(W_(t,t^' ) ) that were reached during the aggregation time window W_(t,t^' ). The formulas to calculate the four values of each candlestick, within an aggregation time window W_(t,t^' ) that has n ticks, and a list of prices P_(W_(t,t^' ) ) , are as follow:
Japanese candlesticks are color-coded to indicate whether the price closed higher or lower than the open price. A green candlestick (can be represented as a hollow or white candlestick) indicates that the close price exceeded the open price. A red candlestick (which can also be filled or black) indicates that the closure price was lower than the open price. Red and green codes are utilized more frequently than the other two sets of color codes, based on empirical evidence. In the literature Japanese candlesticks are also referred to as OHLC data, such as in.
Heikin-Ashi Candlesticks
Heikin-Ashi candlesticks are a type of candlesticks that is derived from Japanese candlesticks. They are designed to make it easier to visually identify trends in the market (17). For a given aggregation time window W(t,t^') that has n ticks, and a list of prices P(W(t,t^' ) ), the Heikin-Ashi candlesticks are calculated using the following formulas:
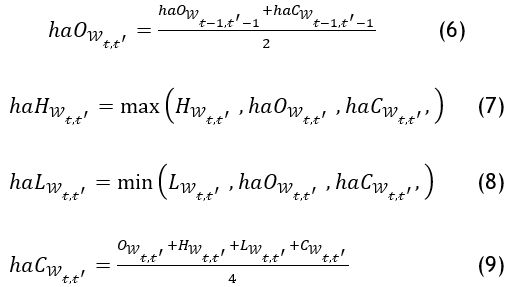
Heikin-Ashi candlesticks are smoother than Japanese candlesticks because they use an average of the previous period's open and close prices to calculate the open price.
Logarithmic returns
While it might seem straightforward to use the simple returns in price forecasting, logarithmic returns of the target feature are used instead (the close price is generally used as the target feature). The reason we use logarithmic returns is due to their characteristics mainly the time additivity and symmetry. The logarithmic returns are widely used in the cryptocurrency price forecasting tasks.(22,23)
The formula to calculate the logarithmic return using the close price of a cryptocurrency over an aggregation time window Wt,t' is as follows:
![]()
For each aggregation time window, we calculated the Heikin-Ashi candlesticks OHLC, and the one step into the future logarithmic return of the close price. The final used datasets are two: for each aggregation time window we combine the ohlc data of Japanese or Heikin-Ashi candlesticks with, the number of trades, the volume of trades (sum of volumes per trade), the body, the upper and bottom shadows of the candlestick and the target feature which consists of the single-step into the future logarithmic return of the close price. PyCaret autoML library(24) is used for the rest of the tasks, with the use of timeseries split strategy with 10 folds. the time series split ensures a more realistic evaluation by using only historical data for training and reserving future data for testing. This aligns with the actual nature of cryptocurrency time-based data where we cannot forecast the future based on data that hasn't yet occurred. Missing values are replaced with simple mean-based imputation. Each dataset is splitted into a training split consisting of 57,14 % of data and a test split containing 42,86 %. Data is normalized using z-score to lesser the effect of data outliers on used algorithms.
Machine learning regression algorithms
To conduct our comparison 5 regressors are used: Huber Regressor, kNN Regressor, Light Gradient Boosting Machine, Linear Regression and Random Forest Regressor.
Huber regressor
A Huber regressor is
a regression algorithm that uses The Huber loss function which is a hybrid loss
function that combines squared loss for samples within a certain threshold
(epsilon) and absolute loss for samples beyond a defined threshold  . The objective function using the Huber Loss function Hϵ is defined as
follow:
. The objective function using the Huber Loss function Hϵ is defined as
follow:
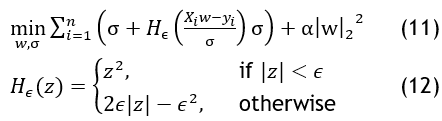
This approach aims to balance robustness to outliers with sensitivity to their influence. In contrast to least squares regression, which penalizes outliers heavily, the Huber loss function penalizes outliers less heavily, thus reducing their impact on the overall regression fit.(25)
kNN regressor
kNN (K-Nearest Neighbors) regressor is a type of non-parametric, instance-based learning algorithm used in statistics and machine learning. Unlike parametric methods, kNN does not make assumptions about the underlying data distribution and uses the data itself for making predictions. It estimates the value of a continuous variable based on the 'K' nearest neighbors, where 'K' is a user-defined constant. The basic idea is that similar data points (neighbors) will have similar output values.(26) The first step in KNN regression is to find the 'K' closest points (neighbors) to the query point. This is typically done using a distance metric like Euclidean distance. The formula for Euclidean distance between two points x and y in a 2-dimensional space is:
![]()
Once
the 'K' nearest neighbors are identified, the output is the average of the
dependent variable for these neighbors. The formula for the prediction ![]() is:
is:
![]()
Where
![]() are the values of the 'K' nearest neighbors.
are the values of the 'K' nearest neighbors.
KNN regressor is a flexible, easy-to-understand algorithm that can be very effective for certain datasets, especially those where the relationship between variables is complex and not easily captured by parametric models. However, its performance depends heavily on the choice of 'K', the distance metric, and the data's dimensionality and scaling.
Light Gradient Boosting Machine
Light Gradient Boosting Machine (LightGBM) is an advanced ensemble machine learning algorithm based on decision trees, optimized for speed and efficiency. Initially, LightGBM creates a model that predicts the mean of the target variable. It then iteratively improves this model by building trees to predict residuals or errors from the current predictions. These residuals are computed as the negative gradient of the loss function, and the model updates by adding a fraction of the new tree's predictions. Key optimizations in LightGBM, like Gradient-based One-Side Sampling (GOSS) and histogram-based tree splitting, focus on processing efficiency and handling large datasets effectively.(26)
Linear regression
The linear regressor constitutes a basic machine learning model employed to forecast a dependent variable by considering one or more independent variables. The model posits a linear association between the input(s) and the output.(27) The formula for a simple linear regression with one independent variable is:
![]()
The dependent variable is denoted by Y and the independent variable is denoted by X, β0 denotes the y-intercept, β1 reflects the slope of the line (illustrating the change in Y with a one-unit alteration in X), and ϵ represents the error term. In the scenario of multiple linear regression involving numerous independent variables, the formula extends to incorporate these additional factors:
![]()
The objective of the model is to identify the optimal linear relationship by minimizing the sum of the squared variances between the observed and predicted values.
Random Forest regressor
Random Forest, an ensemble learning technique predominantly employed for classification and regression purposes, functions by creating numerous decision trees in the training phase. In regression tasks, the collective prediction is obtained by averaging the individual tree predictions. The fundamental concept revolves around amalgamating forecasts from multiple tree models, thereby enhancing overall performance and mitigating overfitting.(28) The formula for a Random Forest model's prediction is the average of the predictions from all the individual trees:
![]()
Where  is the predicted output, is the number of trees in the forest,
  represents the prediction from the
  tree, and
  are the input features.
Evaluation metrics
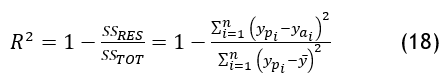
R2
R2 is a useful metric for assessing the goodness of fit of a regression model. It provides insights into how well the model's predictions align with the actual observed values. A higher R2 value suggests a better fit, indicating that the model captures a larger proportion of the variability in the target variable.
RMSLE
Root Mean Squared Logarithmic Error (RMSLE) is calculated by applying the natural logarithm to both the actual and predicted values and then taking the root mean square error of the differences. RMSLE is less sensitive to outliers than other error metrics, such as mean squared error, because it reduces the impact of large errors. Additionally, RMSLE penalizes underestimation more heavily than overestimation, making it a suitable choice for situations where underestimation is more costly than overestimation.(29)
![]()
We used Root Mean Squared Logarithmic Error (RMSLE) and R-squared because they are advantageous for evaluating time series forecasting models in specific contexts. RMSLE is useful for its sensitivity to relative errors rather than absolute ones, making it ideal for data with a wide range of values. It also penalizes underestimations less than overestimations and is less sensitive to outliers due to its logarithmic nature R-squared, on the other hand, measures how much variance in the dependent variable is explained by the model, offering an intuitive understanding of model performance. It's also scale-independent, allowing for comparisons across different datasets or scales.(29,30,31,32,33,34) These metrics provide benefits over traditional ones like MAE or RMSE by offering better interpretability, being more suited to certain types of data (like those with non-linear relationships or uneven variance) and offering robustness against specific types of errors.(35,36,37,38,39,40,41)
RESULTS AND DISCUSSION
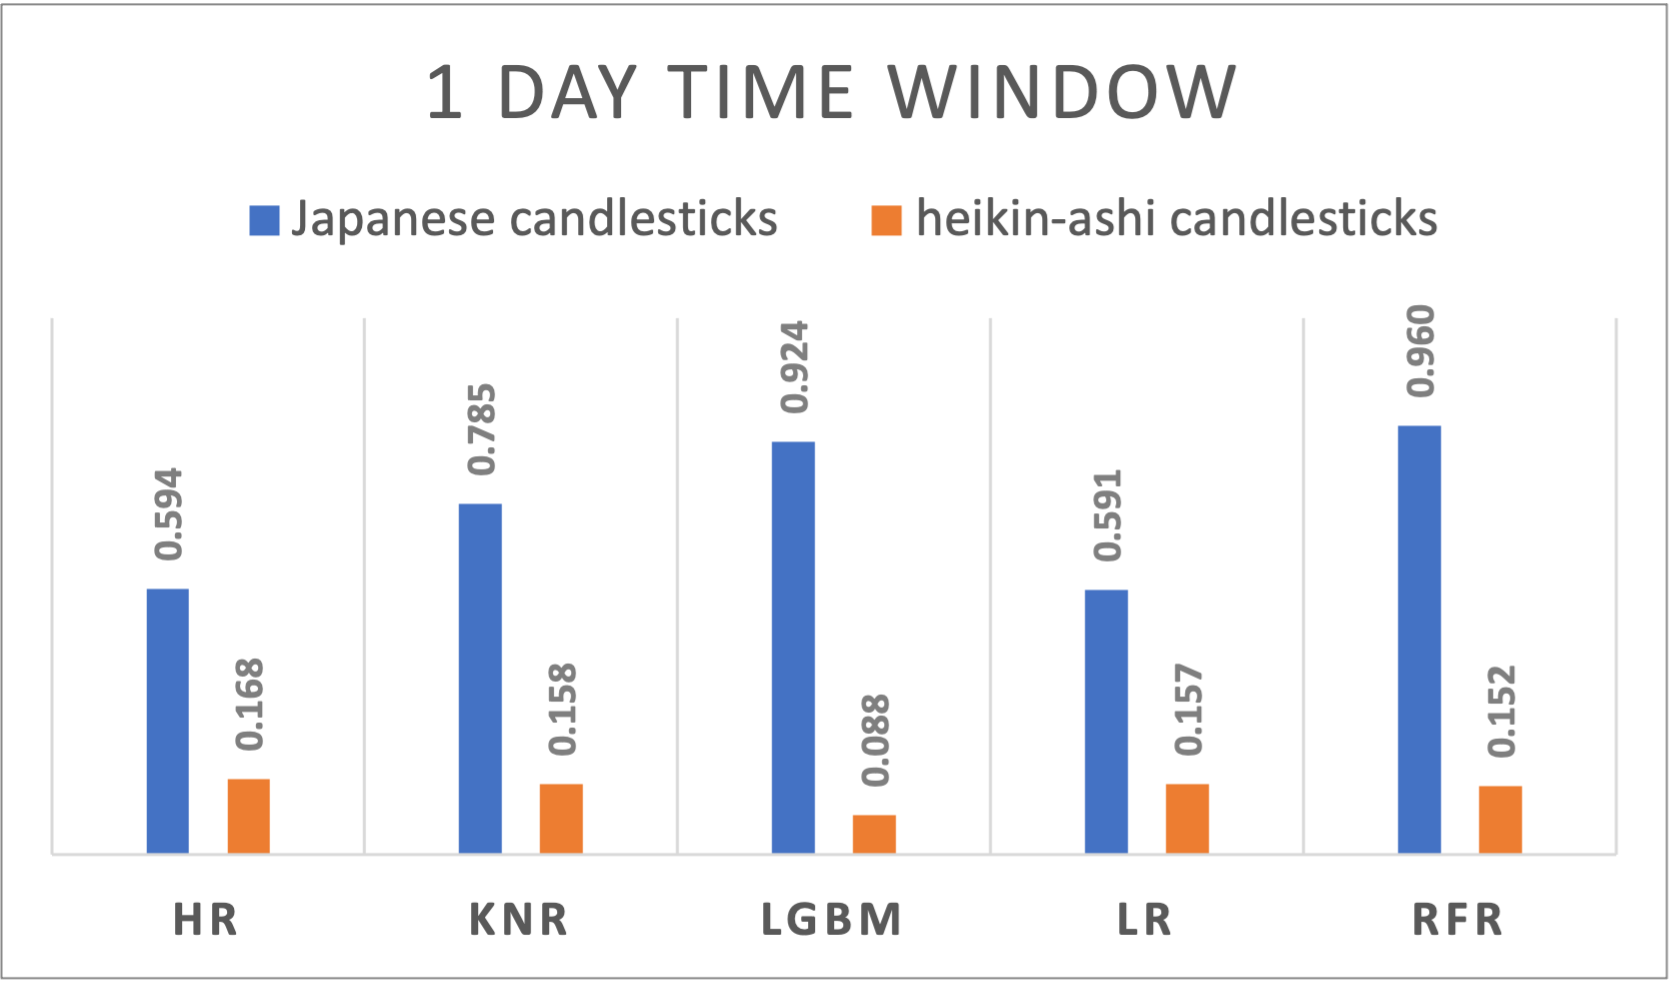
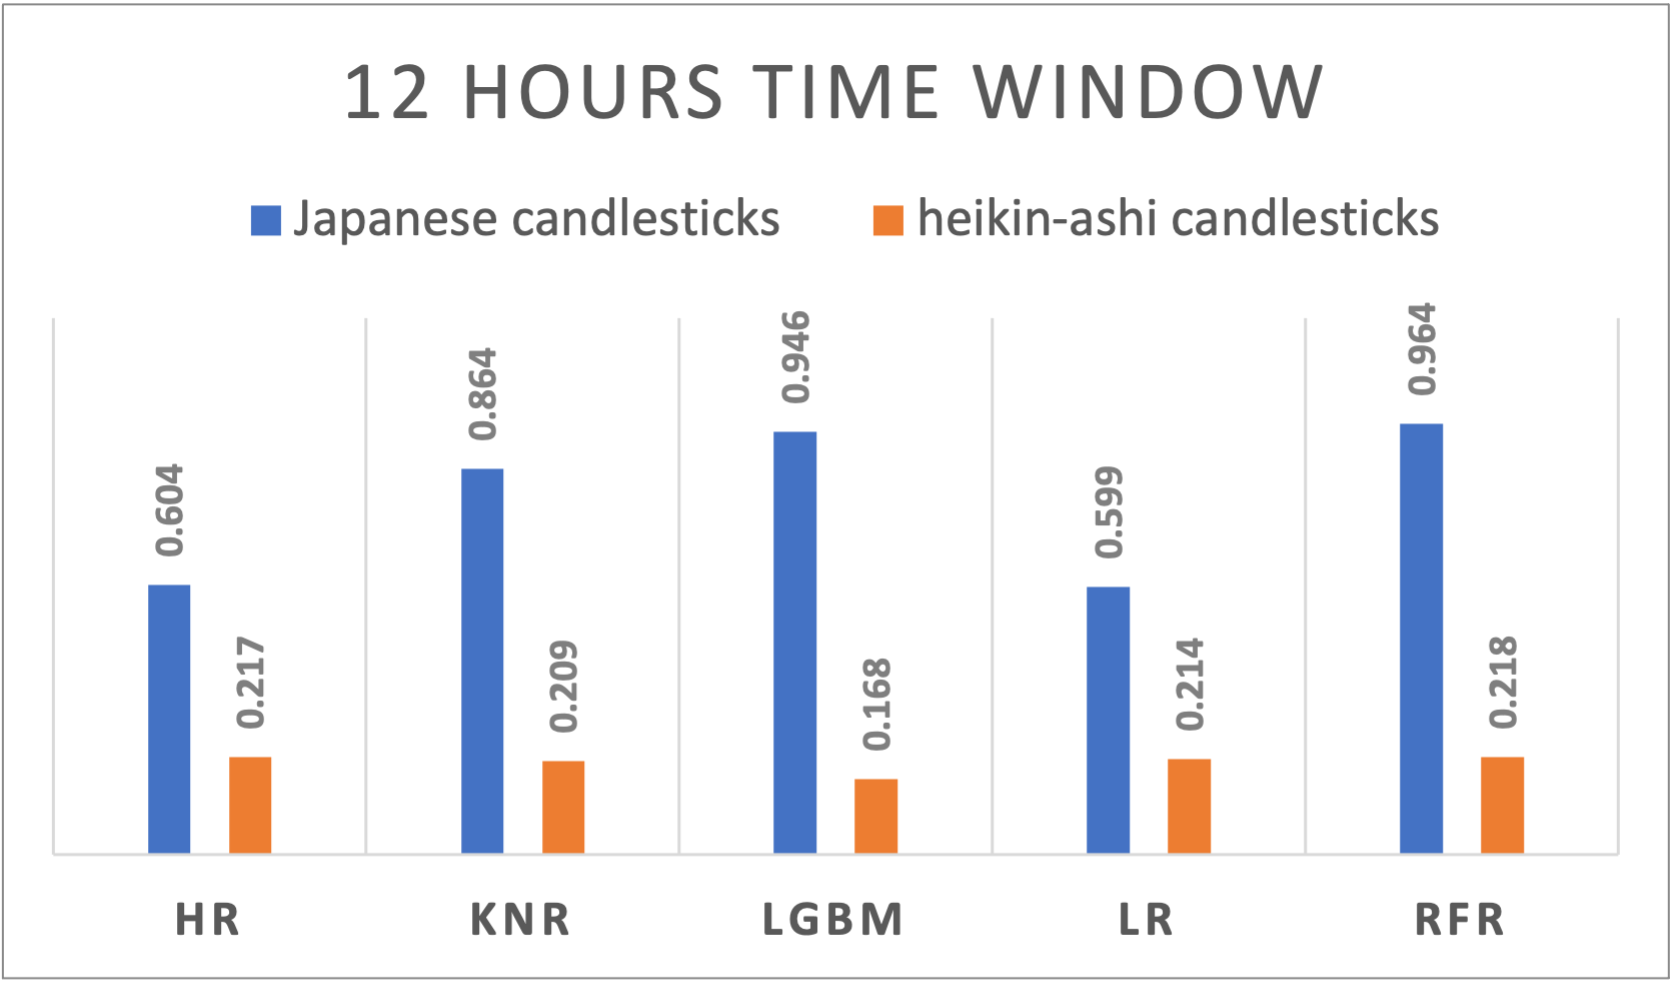
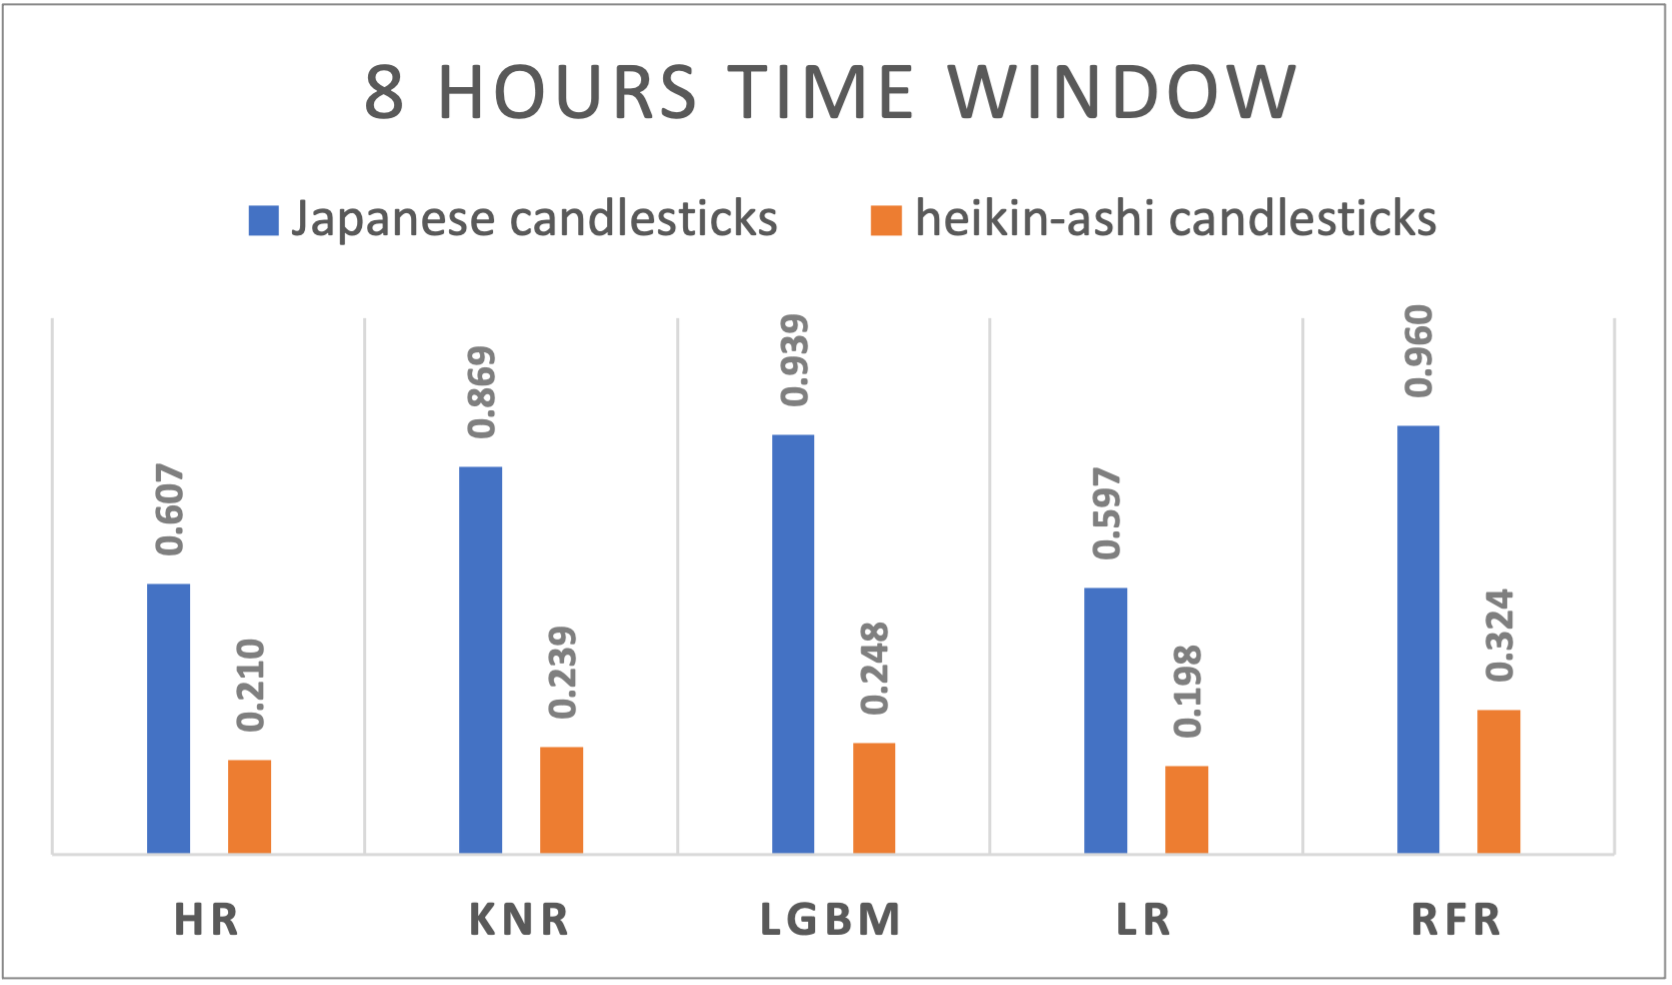
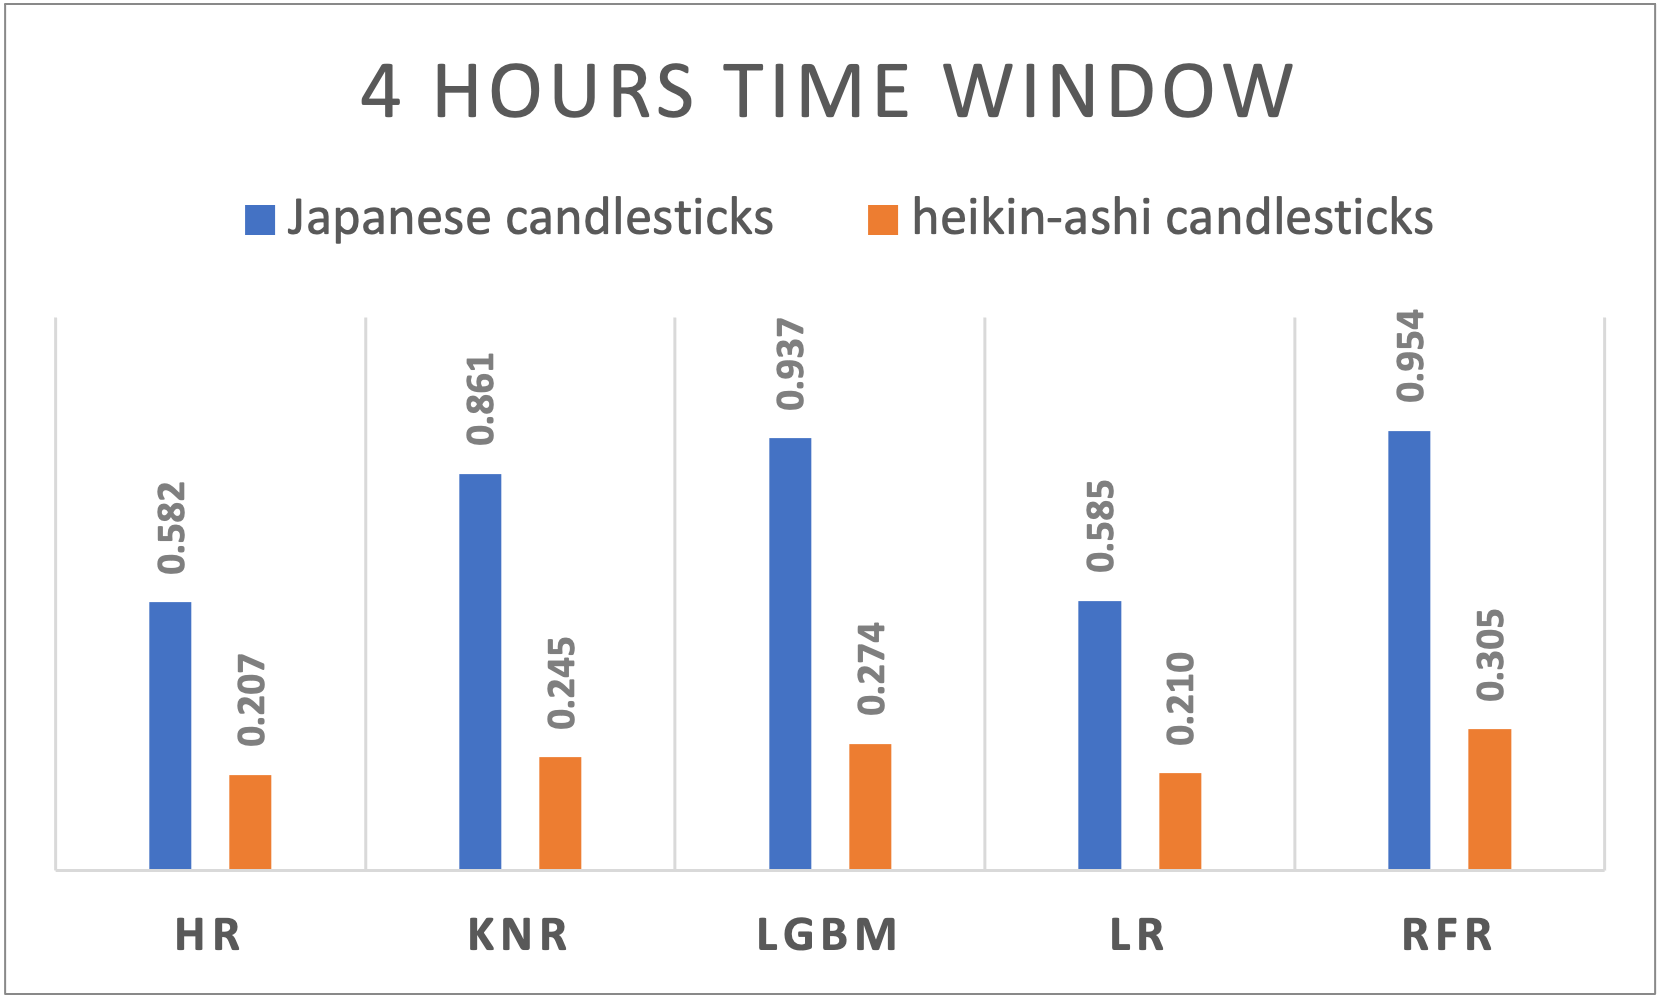
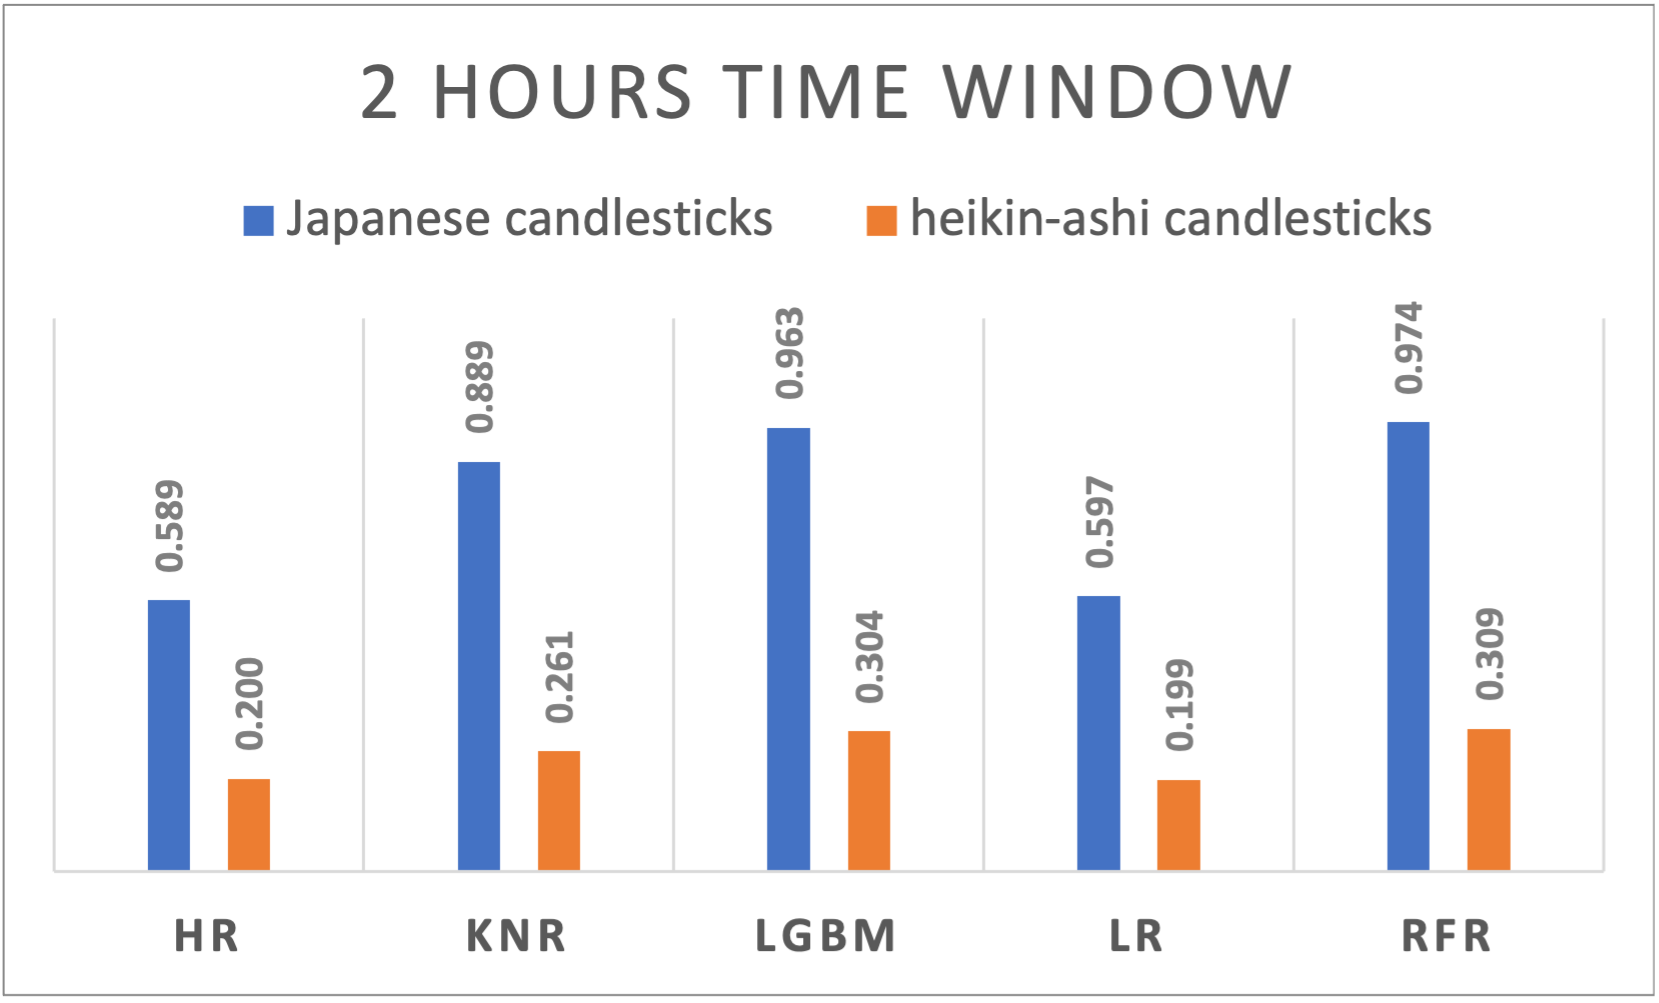
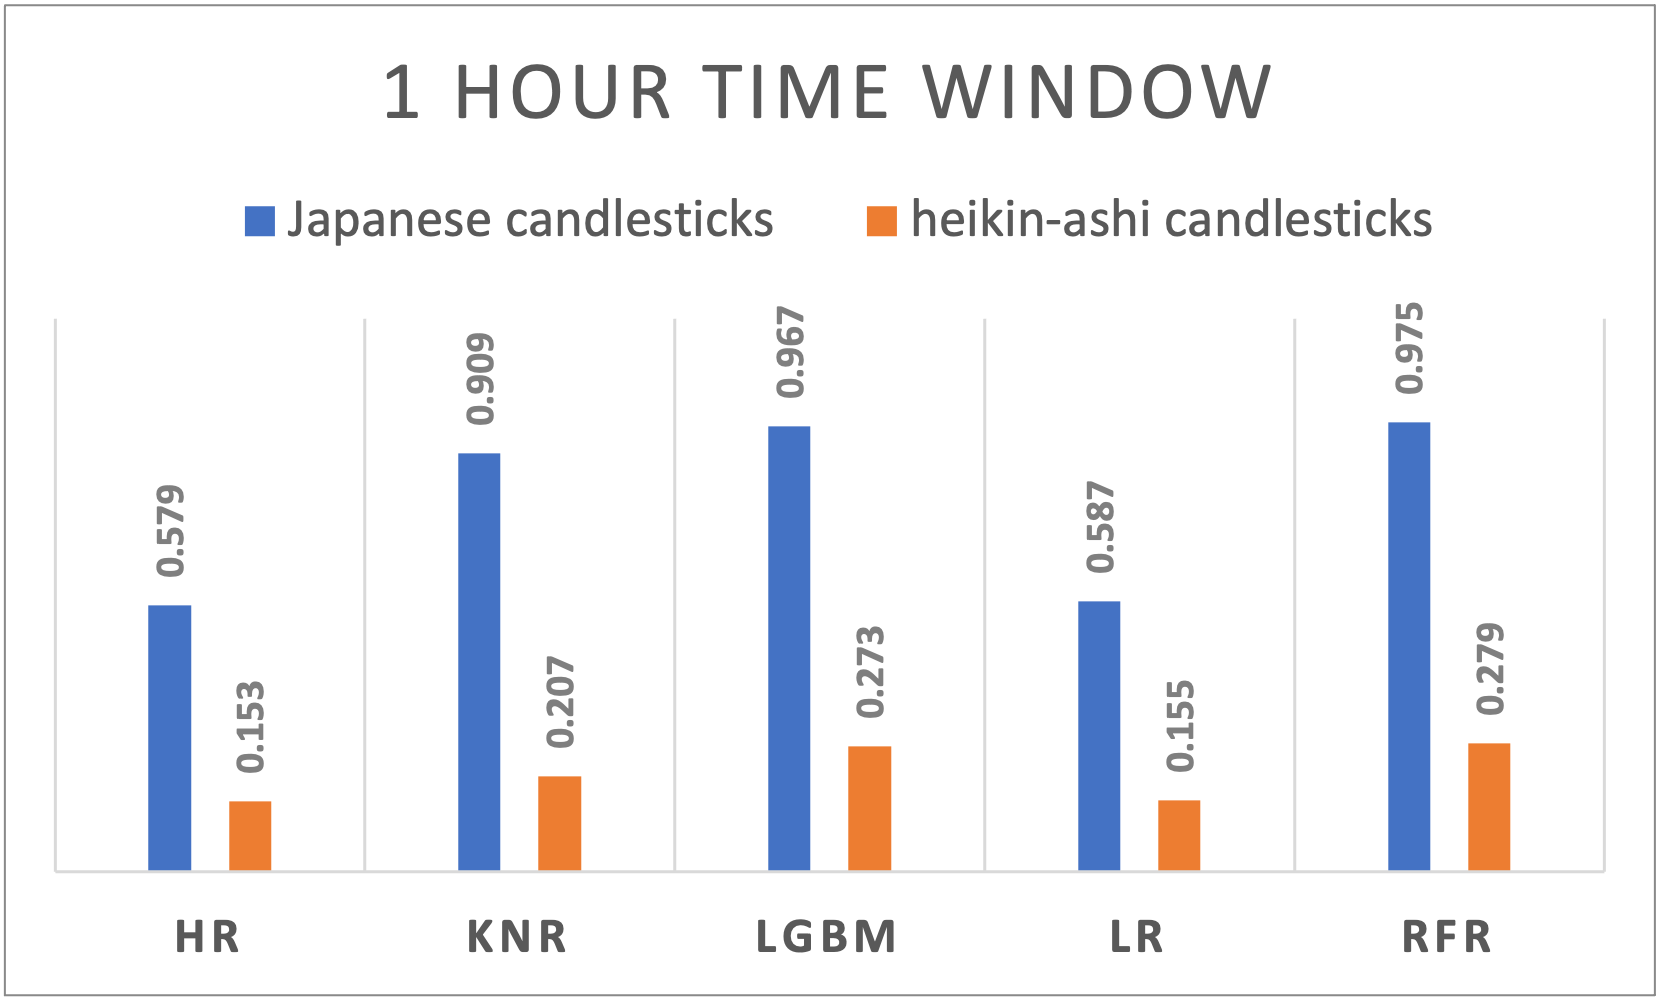
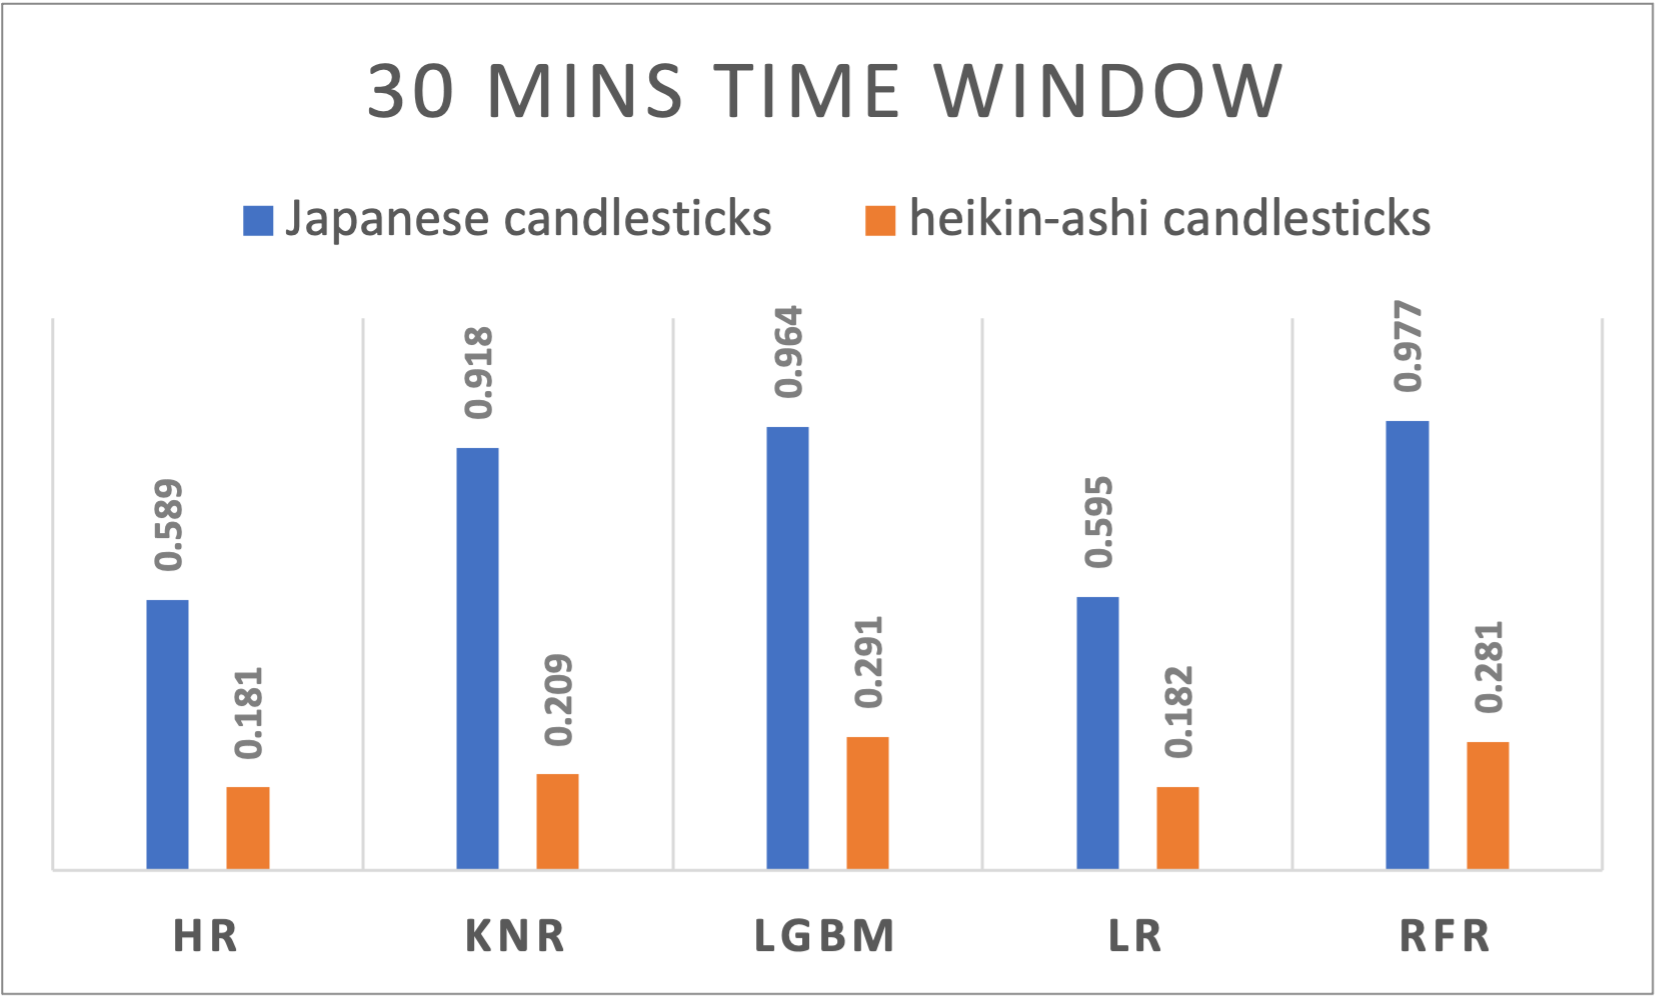
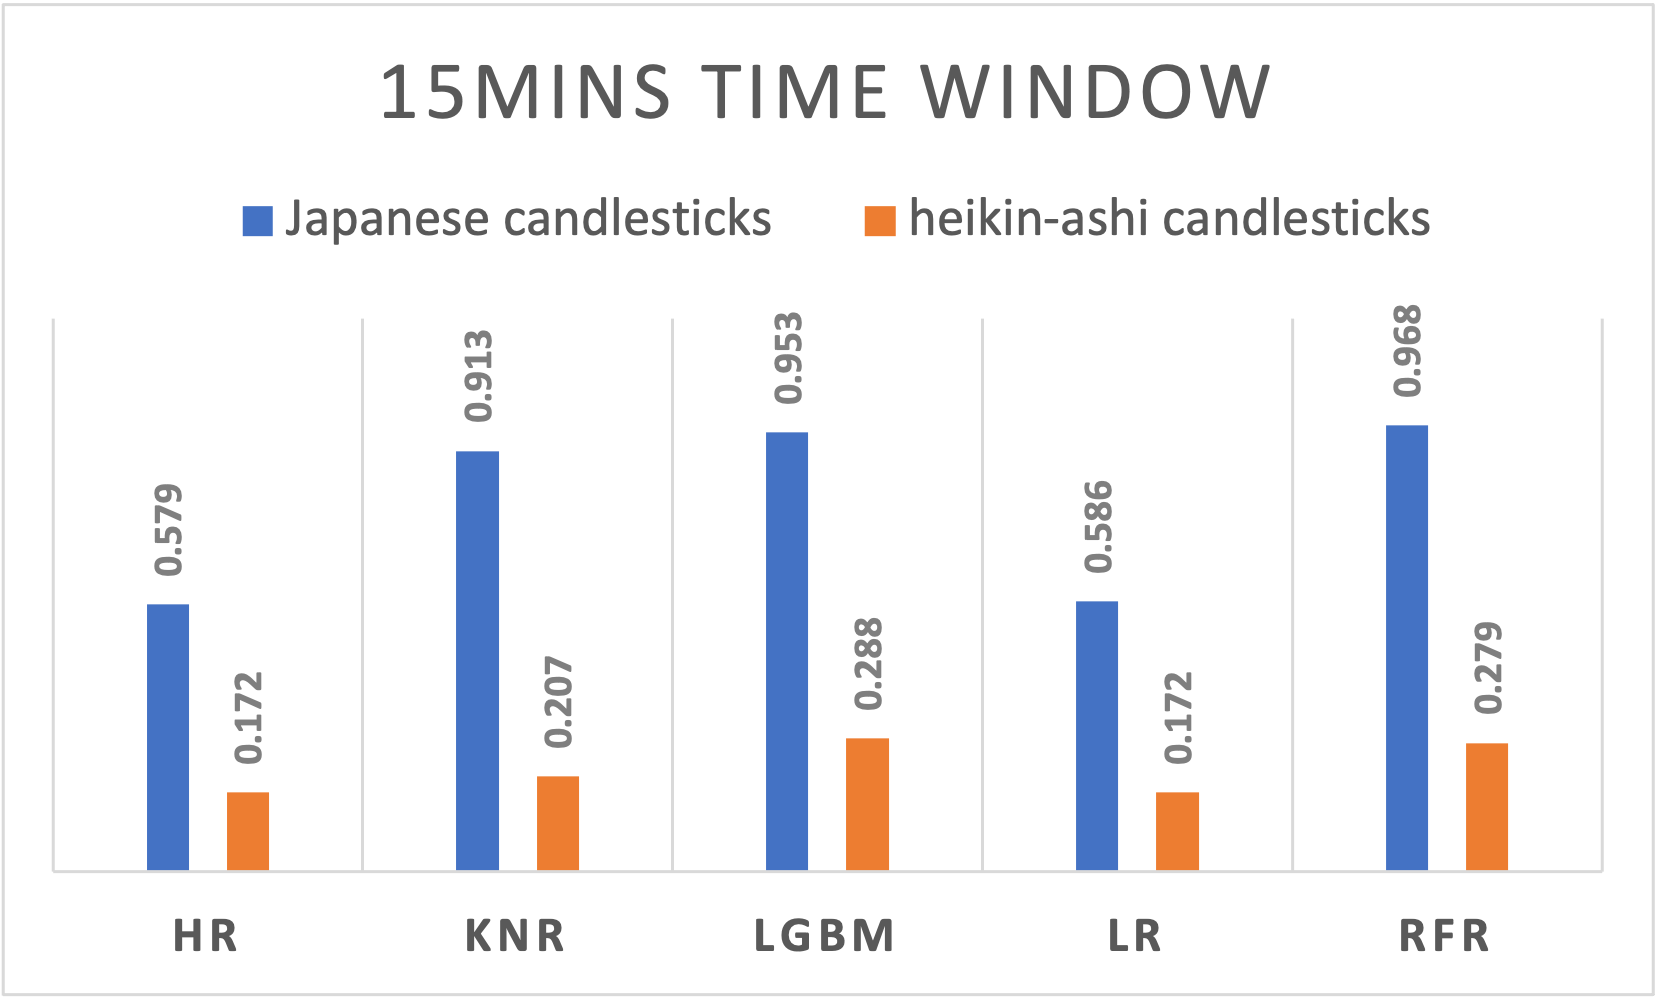
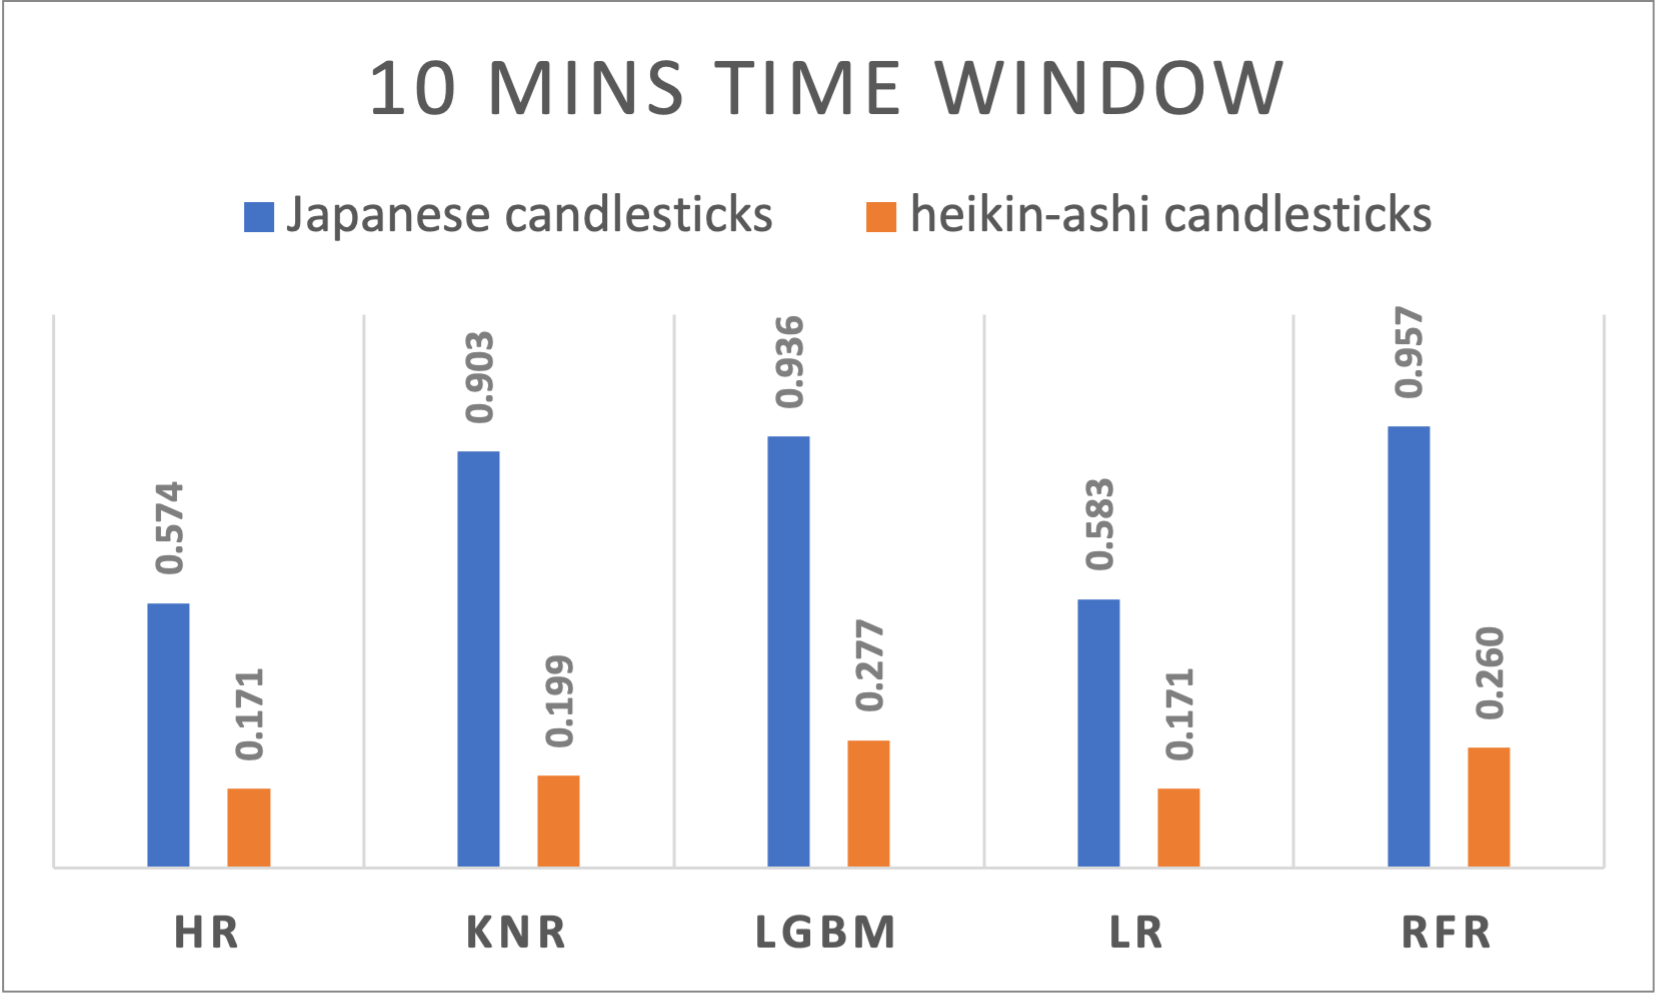
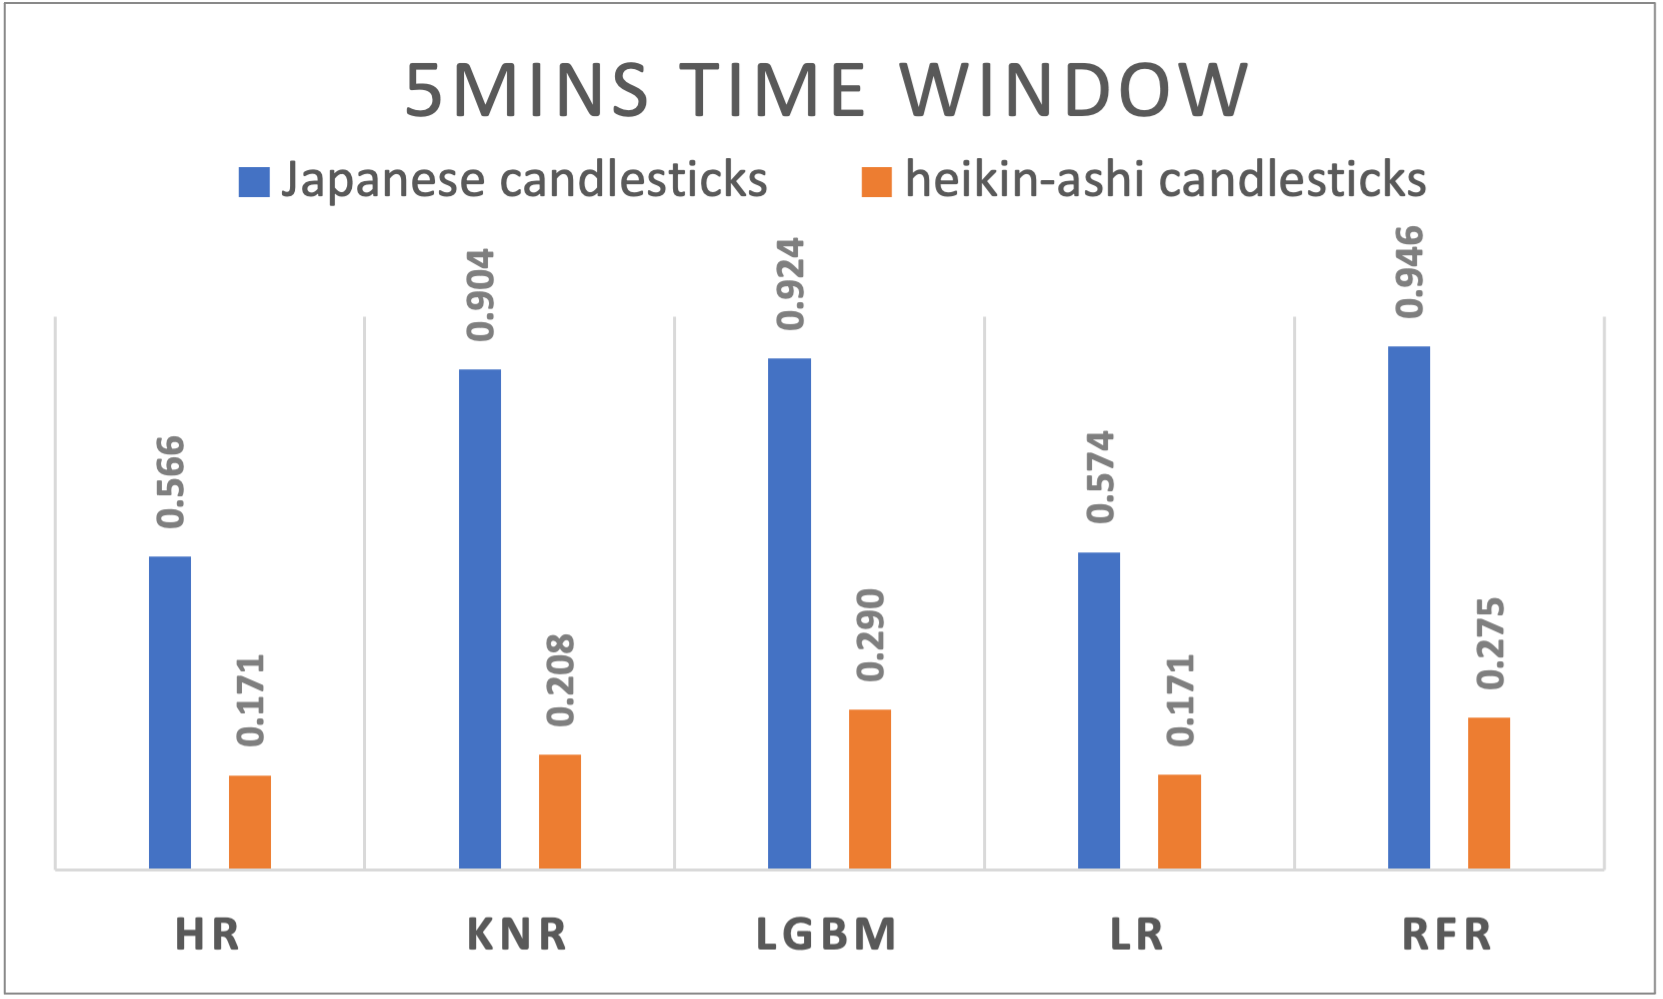
Table 1 represents the detailed results of all time windows and all the regression algorithms results that have been used for both Japanese and Heikin-Ashi candlesticks. To visualize the results, figures from figure 1. To figure 10 suggests a side-by-side comparison of the R2 results of Japanese and Heikin-Ashi candlesticks for each time window. The abbreviations used within the chart to represents different algorithms are HR : Huber Regressor, KNR : kNN Regressor, LGBM : Light Gradient Boosting Machine, LR: Linear Regression and RFR: Random Forest Regressor. The reporting order of the results was based on alphabetical ordering of the algorithms.
|
Figure 1. R-squared results of different algorithms applied to Japanese and Heikin-Ashi candlesticks using 1 day time window
|
Figure 2. R-squared results of different algorithms applied to Japanese and Heikin-Ashi candlesticks using 12 hours’ time window
|
|
Figure 3. R-squared results of different algorithms applied to Japanese and Heikin-Ashi candlesticks using 8 hours’ time window |
Figure 4. R-squared results of different algorithms applied to Japanese and Heikin-Ashi candlesticks using 4 hours’ time window |
|
Figure 5. R-squared results of different algorithms applied to Japanese and Heikin-Ashi candlesticks using 2 hours’ time window
|
Figure 6. R-squared results of different algorithms applied to Japanese and Heikin-Ashi candlesticks using 1 hour time window
|
|
Figure 7. R-squared results of different algorithms applied to Japanese and Heikin-Ashi candlesticks using 30 minutes time window
|
Figure 8. R-squared results of different algorithms applied to Japanese and Heikin-Ashi candlesticks using 15 minutes time window
|
|
Figure 9. R-squared results of different algorithms applied to Japanese and Heikin-Ashi candlesticks using 10 minutes time window |
Figure 10. R-squared results of different algorithms applied to Japanese and Heikin-Ashi candlesticks using 5 minutes time window |
|
Table 1. R2 and RMSLE results of Japanese and Heikin-Ashi candlesticks using different ML algorithms over different time windows |
|||||
|
Time window size |
|
Japanese candlesticks |
Heikin-Ashi candlesticks |
||
|
Algorithm |
R2 |
RMSLE |
R2 |
RMSLE |
|
|
1day |
HR |
0,594 |
0,0212 |
0,1684 |
0,0268 |
|
KNR |
0,7846 |
0,0138 |
0,1582 |
0,0239 |
|
|
LGBM |
0,9243 |
0,0084 |
0,0879 |
0,0229 |
|
|
LR |
0,5911 |
0,0213 |
0,1569 |
0,0269 |
|
|
RFR |
0,9603 |
0,0064 |
0,1521 |
0,0226 |
|
|
12h |
HR |
0,6036 |
0,0154 |
0,217 |
0,0194 |
|
KNR |
0,8635 |
0,0087 |
0,2094 |
0,0162 |
|
|
LGBM |
0,9455 |
0,0054 |
0,1683 |
0,0159 |
|
|
LR |
0,5994 |
0,0155 |
0,2138 |
0,0195 |
|
|
RFR |
0,9641 |
0,0043 |
0,2179 |
0,0159 |
|
|
8h |
HR |
0,6065 |
0,0135 |
0,2101 |
0,0174 |
|
KNR |
0,8686 |
0,0075 |
0,2392 |
0,0147 |
|
|
LGBM |
0,939 |
0,005 |
0,2483 |
0,014 |
|
|
LR |
0,5971 |
0,0136 |
0,198 |
0,0173 |
|
|
RFR |
0,9604 |
0,004 |
0,3241 |
0,0135 |
|
|
4h |
HR |
0,5816 |
0,0104 |
0,2067 |
0,0132 |
|
KNR |
0,8607 |
0,0057 |
0,2449 |
0,011 |
|
|
LGBM |
0,9371 |
0,0037 |
0,2741 |
0,0106 |
|
|
LR |
0,5852 |
0,0104 |
0,2104 |
0,0131 |
|
|
RFR |
0,9541 |
0,0032 |
0,3053 |
0,0104 |
|
|
2h |
HR |
0,5886 |
0,0076 |
0,2003 |
0,0097 |
|
KNR |
0,8892 |
0,0037 |
0,2609 |
0,0077 |
|
|
LGBM |
0,9629 |
0,0021 |
0,3039 |
0,0075 |
|
|
LR |
0,5972 |
0,0075 |
0,1986 |
0,0096 |
|
|
RFR |
0,9744 |
0,0017 |
0,3094 |
0,0075 |
|
|
1h |
HR |
0,5786 |
0,0055 |
0,1529 |
0,0071 |
|
KNR |
0,9087 |
0,0024 |
0,207 |
0,0056 |
|
|
LGBM |
0,9674 |
0,0014 |
0,2728 |
0,0054 |
|
|
LR |
0,5871 |
0,0054 |
0,1546 |
0,007 |
|
|
RFR |
0,975 |
0,0012 |
0,2786 |
0,0054 |
|
|
30mins |
HR |
0,5887 |
0,004 |
0,1811 |
0,0051 |
|
KNR |
0,9177 |
0,0017 |
0,2092 |
0,0041 |
|
|
LGBM |
0,9643 |
0,0011 |
0,2909 |
0,004 |
|
|
LR |
0,5952 |
0,0039 |
0,1819 |
0,005 |
|
|
RFR |
0,9769 |
0,0009 |
0,2806 |
0,0039 |
|
|
15mins |
HR |
0,5788 |
0,0029 |
0,1717 |
0,0037 |
|
KNR |
0,9125 |
0,0013 |
0,2066 |
0,0029 |
|
|
LGBM |
0,9525 |
0,0009 |
0,2883 |
0,0029 |
|
|
LR |
0,5862 |
0,0029 |
0,1716 |
0,0036 |
|
|
RFR |
0,9683 |
0,0007 |
0,2785 |
0,0028 |
|
|
10mins |
HR |
0,5741 |
0,0024 |
0,1705 |
0,0031 |
|
KNR |
0,9031 |
0,0011 |
0,199 |
0,0025 |
|
|
LGBM |
0,9356 |
0,0009 |
0,2767 |
0,0024 |
|
|
LR |
0,5826 |
0,0024 |
0,1711 |
0,003 |
|
|
RFR |
0,9567 |
0,0007 |
0,2598 |
0,0024 |
|
|
5mins |
HR |
0,5656 |
0,0018 |
0,1705 |
0,0022 |
|
KNR |
0,9041 |
0,0008 |
0,2077 |
0,0017 |
|
|
LGBM |
0,9237 |
0,0007 |
0,2895 |
0,0017 |
|
|
LR |
0,5739 |
0,0018 |
0,1711 |
0,0022 |
|
|
RFR |
0,9461 |
0,0006 |
0,2752 |
0,0017 |
|
DISCUSSION OF RESULTS
Analyzing the results reveals intriguing patterns. Across Japanese candlesticks, random forest regressor consistently stands out, showcasing its prowess in capturing the complex and non-linear relationships inherent in cryptocurrency markets. linear regression and kNN regressor exhibit variability, reflecting the challenge of linear models in such dynamic environments.
Eventhough Heikin-Ashi candlesticks are designed to reduce noise and emphasize trend direction, they present low forecasting results. The performant algorithms in terms of R2 values are random forest regressor from 12 hours to 1 hour, and lightgbm for smaller windows size and the outperformance. The the huber regressor lead to better results for the daily based time window confirm its performance on small datasets.
Different time windows expose the algorithms to varied market dynamics and data frequencies.
Random forest regressor, known for its ensemble nature, demonstrates robustness across various time windows. This is due to its ability to handle non-linear relationships and capture complex patterns in the bitcoin market. The consistent high R2 values and low RMSLE scores indicate that random forest regressor effectively captures the underlying patterns in bitcoin log returns. Linear Regression and kNN regressor exhibit more variable performance.
A varying performance across time windows is noticeable and suggests the dynamic nature of cryptocurrency markets. Japanese candlesticks exhibited a slightly decreasing behavior when passing from a larger window size to a smaller one the R2 results are ranging from 0,9603 for daily time windows, to 0,9461 for 5 minutes time windows. Even though it’s way less performant compared to the Japanese candlesticks, Heikin-Ashi performed differently on different time window sizes. With a peak at the 8 hours’ time window, the performance decreases if we move on both sides increasing or decreasing the time window.
CONCLUSION
In our comparative study, we used five regression algorithms to forecast bitcoin log returns, evaluating their efficacy concerning both Japanese candlesticks and Heikin-Ashi candlesticks across an array of selected time windows. The insights garnered from this analysis are paramount in drawing meaningful conclusions.
The algorithmic selection process is of utmost significance, as highlighted in this study. It underscores the critical nature of aligning algorithms with the unique characteristics of cryptocurrency markets. Ensemble methods, specifically the Random Forest and Light Gradient Boosting algorithms, emerge as stalwart choices (compared to the other used algorithms), showcasing their adaptability to the intricate dynamics inherent in bitcoin price movements.
Moreover, our findings reveal a nuanced interplay between different types of candlesticks. Contrary to expectations, Japanese candlesticks exhibit superiority over Heikin-Ashi candlesticks. This underscores the need for meticulous consideration of preprocessing strategies to optimize the signal-to-noise ratio, thereby improving forecasting accuracy in cryptocurrency markets.
Temporal considerations are integral to our analysis, elucidating the impact of time window sizes on algorithmic performance. While certain algorithms prove sensitive to the chosen time windows, others exhibit versatility by consistently capturing trends across varying temporal scopes.
The perspectives gleaned from this study pave the way for intriguing avenues of future work. Exploring deep learning techniques and other AI techniques, refining preprocessing methodologies, exploring more technical indicators, and applying them to different forecasting horizons, and delving into will be imperative for the continual enhancement of predictive models.
REFERENCES
1. Dyhrberg AH. Bitcoin, gold and the dollar – A GARCH volatility analysis. Finance Research Letters. 2016 Feb;16,85–92.
2. Hubrich S. “Know When to Hodl Em, Know When to Fodl Em”: An Investigation of Factor Based Investing in the Cryptocurrency Space. SSRN Journal [Internet]. 2017 [cited 2023 Dec 6]; Available from: https://www.ssrn.com/abstract=3055498
3. El Youssefi A, Hessane A, Farhaoui Y, Zeroual I. Cryptocurrency Returns Clustering Using Japanese Candlesticks: Towards a Programmatic Trading System. In: Mabrouki J, Mourade A, Irshad A, Chaudhry SA, editors. Advanced Technology for Smart Environment and Energy [Internet]. Cham: Springer International Publishing; 2023 [cited 2023 Dec 7]. p. 93,103. (Environmental Science and Engineering). Available from: https://link.springer.com/10,1007/978,3-031,25662-2,8
4. Aspris A, Foley S, Svec J, Wang L. Decentralized exchanges: The “wild west” of cryptocurrency trading. International Review of Financial Analysis. 2021 Oct;77,101845.
5. Barbon A, Ranaldo A. On The Quality Of Cryptocurrency Markets: Centralized Versus Decentralized Exchanges. 2021 [cited 2023 Dec 4]; Available from: https://arxiv.org/abs/2112,07386
6. Lyukevich I, Gorbatenko I, Bessonova E. Cryptocurrency Market: Choice of Technical Indicators in Trading Strategies of Individual Investors. In: 3rd International Scientific Conference on Innovations in Digital Economy [Internet]. Saint - Petersburg Russian Federation: ACM; 2021 [cited 2023 Dec 4]. p. 408,16. Available from: https://dl.acm.org/doi/10,1145/3527049,3527089
7. Corbet S, Eraslan V, Lucey B, Sensoy A. The effectiveness of technical trading rules in cryptocurrency markets. Finance Research Letters. 2019 Dec;31,32–7.
8. Amirzadeh R, Nazari A, Thiruvady D. Applying Artificial Intelligence in Cryptocurrency Markets: A Survey. Algorithms. 2022 Nov 14,15(11):428.
9. Thakkar A, Chaudhari K. A Comprehensive Survey on Portfolio Optimization, Stock Price and Trend Prediction Using Particle Swarm Optimization. Arch Computat Methods Eng. 2021 Jun;28,4):2133,64.
10. Almansour BY, Alshater MM, Almansour AY. Performance of ARCH and GARCH Models in Forecasting Cryptocurrency Market Volatility. iems. 2021 Jun 30,20(2):130,9.
11. Dudek G, Fiszeder P, Kubus P, Orzeszko W. Forecasting Cryptocurrencies Volatility Using Statistical and Machine Learning Methods: A Comparative Study [Internet]. SSRN; 2023 [cited 2023 Dec 4]. Available from: https://www.ssrn.com/abstract=4409549
12. Akyildirim E, Goncu A, Sensoy A. Prediction of cryptocurrency returns using machine learning. Ann Oper Res. 2021 Feb;297,1–2):3,36.
13. Shakri IH. Time series prediction using machine learning: a case of Bitcoin returns. SEF. 2022 Apr 22,39(3):458,70.
14. Mahayana D, Madyaratri SA, Fadhl ’Abbas M. Predicting Price Movement of the BTCUSDT Pair Using LightGBM Classification Modeling for Cryptocurrency Trading. In: 2022,12th International Conference on System Engineering and Technology (ICSET) [Internet]. Bandung, Indonesia: IEEE; 2022 [cited 2023 Dec 5]. p. 01,6. Available from: https://ieeexplore.ieee.org/document/10010808/
15. Lahmiri S, Bekiros S. Intelligent forecasting with machine learning trading systems in chaotic intraday Bitcoin market. Chaos, Solitons & Fractals. 2020 Apr;133,109641.
16. Madbouly MM, Elkholy M, Gharib YM, Darwish SM. Predicting Stock Market Trends for Japanese Candlestick Using Cloud Model. In: Hassanien AE, Azar AT, Gaber T, Oliva D, Tolba FM, editors. Proceedings of the International Conference on Artificial Intelligence and Computer Vision (AICV2020) [Internet]. Cham: Springer International Publishing; 2020 [cited 2023 Dec 4]. p. 628,45. (Advances in Intelligent Systems and Computing; vol. 1153). Available from: http://link.springer.com/10,1007/978,3-030,44289-7,59
17. Piasecki K, Łyczkowska-Hanćkowiak A. Heikin-Ashi Technique with Use of Oriented Fuzzy Numbers. In: Atanassov KT, Atanassova V, Kacprzyk J, Kałuszko A, Krawczak M, Owsiński JW, et al., editors. Uncertainty and Imprecision in Decision Making and Decision Support: New Advances, Challenges, and Perspectives [Internet]. Cham: Springer International Publishing; 2022 [cited 2023 Dec 4]. p. 60,71. (Lecture Notes in Networks and Systems; vol. 338). Available from: https://link.springer.com/10,1007/978,3-030,95929-6,5
18. El Youssefi A, Hessane A, El Allaoui A, Zeroual I, Farhaoui Y. Heikin Ashi Candlesticks for Cryptocurrency Returns Clustering. In: Farhaoui Y, Rocha A, Brahmia Z, Bhushab B, editors. Artificial Intelligence and Smart Environment [Internet]. Cham: Springer International Publishing; 2023 [cited 2023 Dec 5]. p. 481,5. (Lecture Notes in Networks and Systems; vol. 635). Available from: https://link.springer.com/10,1007/978,3-031,26254-8,69
19. Akyildirim E, Cepni O, Corbet S, Uddin GS. Forecasting mid-price movement of Bitcoin futures using machine learning. Ann Oper Res. 2023 Nov;330,1–2):553,84.
20. Cohen G. Intraday algorithmic trading strategies for cryptocurrencies. Rev Quant Finan Acc. 2023 Jul;61,1):395,409.
21. Binance archived historical spot trading data [Internet]. [cited 2023 Nov 7]. Available from: https://data.binance.vision/?prefix=data/spot/
22. Kolte A, Pawar A, Kumar Roy J, Vida I, Vasa L. Evaluating the Return Volatility of Cryptocurrency Market: An Econometrics Modelling Method. ACTA POLYTECH HUNG. 2022,19(5):107,26.
23. Pichl L, Nan Z, Kaizoji T. Time Series Analysis of Ether Cryptocurrency Prices: Efficiency, Predictability, and Arbitrage on Exchange Rates. In: Pichl L, Eom C, Scalas E, Kaizoji T, editors. Advanced Studies of Financial Technologies and Cryptocurrency Markets [Internet]. Singapore: Springer Singapore; 2020 [cited 2023 Dec 3]. p. 183,96. Available from: http://link.springer.com/10,1007/978,981-15,4498-9,10
24. Moez A. PyCaret: An open source, low-code machine learning library in Python [Internet]. 2020. Available from: https://www.pycaret.org
25. Scikit-learn documentation [Internet]. [cited 2023 Nov 19]. Available from: https://scikit-learn.org/stable/modules/linear_model.html#huber-regression
26. Al Hawi L, Sharqawi S, Al-Haija QA, Qusef A. Empirical Evaluation of Machine Learning Performance in Forecasting Cryptocurrencies. JAIT. 2023,14(4):639--647.
27. Uras N, Marchesi L, Marchesi M, Tonelli R. Forecasting Bitcoin closing price series using linear regression and neural networks models. PeerJ Computer Science. 2020 Jul 6,6:e279.
28. Md AQ, Narayanan SMSS, Sabireen H, Sivaraman AK, Tee KF. A novel approach to detect fraud in Ethereum transactions using stacking. Expert Systems. 2023 Aug;40,7):e13255.
29. Liapis CM, Karanikola A, Kotsiantis S. Investigating Deep Stock Market Forecasting with Sentiment Analysis. Entropy. 2023 Jan 23,25(2):219.
30. Farhaoui, Y., “Design and implementation of an intrusion prevention system” International Journal of Network Security, vol.19,5), pp. 675,683, 2017. DOI: 10,6633/IJNS.201709,19(5).04
31. Farhaoui, Y.and All, Big Data Mining and Analytics, 2023, 6,3), pp. I–II, DOI: 10,26599/BDMA.2022,9020045
32. Farhaoui, Y., “Intrusion prevention system inspired immune systems” Indonesian Journal of Electrical Engineering and Computer Science, vol. 2,1), pp. 168,179, 2016.
33. Farhaoui, Y. , "Big data analytics applied for control systems" Lecture Notes in Networks and Systems, 2018, 25, pp. 408,415. https://doi.org/10,1007/978,3-319,69137-4,36
34. Farhaoui, Y. and All, Big Data Mining and Analytics, 2022, 5,4), pp. I IIDOI: 10,26599/BDMA.2022,9020004
35. Alaoui, S.S., and all. "Hate Speech Detection Using Text Mining and Machine Learning", International Journal of Decision Support System Technology, 2022, 14,1), 80. DOI: 10,4018/IJDSST.286680
36. Alaoui, S.S., and all. ,"Data openness for efficient e-governance in the age of big data", International Journal of Cloud Computing, 2021, 10,5-6), pp. 522,532, https://doi.org/10,1504/IJCC.2021,120391
37. El Mouatasim, A., and all. "Nesterov Step Reduced Gradient Algorithm for Convex Programming Problems", Lecture Notes in Networks and Systems, 2020, 81, pp. 140,148. https://doi.org/10,1007/978,3-030,23672-4,11
38. Tarik, A., and all."Recommender System for Orientation Student" Lecture Notes in Networks and Systems, 2020, 81, pp. 367,370.https://doi.org/10,1007/978,3-030,23672-4,27
39. Sossi Alaoui, S., and all. "A comparative study of the four well-known classification algorithms in data mining", Lecture Notes in Networks and Systems, 2018, 25, pp. 362,373. https://doi.org/10,1007/978,3-319,69137-4,32
40. Farhaoui, Y."Teaching Computer Sciences in Morocco: An Overview", IT Professional, 2017, 19,4), pp. 12,15, 8012307. DOI: 10,1109/MITP.2017,3051325
41. Farhaoui, Y., "Securing a Local Area Network by IDPS Open Source", Procedia Computer Science, 2017, 110, pp. 416,421. https://doi.org/10,1016/j.procs.2017,06.106
FINANCING
There is no funding for this work.
CONFLICT OF INTEREST
The authors declare that there is no conflict of interest.
AUTHORSHIP CONTRIBUTION
Conceptualization: Ahmed El Youssefi, Abdelaaziz Hessane, Imad Zeroual, Yousef Farhaoui.
Research: Ahmed El Youssefi, Abdelaaziz Hessane, Imad Zeroual, Yousef Farhaoui.
Methodology: Ahmed El Youssefi, Abdelaaziz Hessane, Imad Zeroual, Yousef Farhaoui.
Project Management: Ahmed El Youssefi, Abdelaaziz Hessane, Imad Zeroual, Yousef Farhaoui.
Original Drafting-Drafting: Ahmed El Youssefi, Abdelaaziz Hessane, Imad Zeroual, Yousef Farhaoui.
Writing-Revising And Editing: Ahmed El Youssefi, Abdelaaziz Hessane, Imad Zeroual, Yousef Farhaoui.