doi: 10.56294/sctconf2024.1121
Categoría: Finance, Business, Management, Economics and Accounting
ORIGINAL
Innovate to elevate: the role of E-Hrm onemployee effectiveness in IT sector
Innovar para elevar: el papel de E-Hrm en la eficacia del empleado en el sector de TI
Anu P John1
![]() *, Velmurugan V.P1
*, Velmurugan V.P1
![]() *
*
1Research Scholar, Faculty of Management Studies, Noorul Islam Centre for Higher Education. Kanyakumari, Tamil Nadu, India.
Cite as: John AP, Velmurugan V. Innovate To Elevate: The Role Of E-Hrm Onemployee Effectiveness In It Sector. Salud, Ciencia y Tecnología - Serie de Conferencias.2024 Aug. 30; 3:.1121. https://doi.org/10.56294/sctconf2024.1121
Submitted: 04-02-2024 Revised: 13-05-2024 Accepted: 01-09-2024 Published: 02-09-2024
Corresponding author: Anu P John *
Editor: Dr.
William Castillo-González ![]()
ABSTRACT
Introduction: the efficacy of e-HRM techniques is demonstrated by the results, which show that these components have a significant explanatory power in predicting satisfaction.
Methods: the overall impact of e-HRM practices in influencing employee satisfaction within the IT sector is indicated by the ANOVA results.
Results: the study emphasizes how e-HRM is frequently used in the IT industry and how important it is to day-to-day operations.
Conclusion: the results also highlight the necessity of ongoing research and development in e-HRM practices in order to solve current issues and guarantee optimal use in the constantly changing IT environment.
Key Words: e-HRM; IT Sector; Employee Satisfaction; Organization; Technology; Cronbach’s Alpha; ANOVA.
RESUMEN
Introducción: la eficacia de las técnicas de e-HRM queda demostrada por los resultados, que muestran que estos componentes tienen un importante poder explicativo en la predicción de la satisfacción.
Métodos: los resultados de ANOVA indican el impacto general de las prácticas de e-HRM a la hora de influir en la satisfacción de los empleados dentro del sector de TI.
Resultados: el estudio enfatiza cómo e-HRM se utiliza con frecuencia en la industria de TI y cuán importante es para las operaciones diarias.
Conclusión: los resultados también resaltan la necesidad de investigación y desarrollo continuos en prácticas de e-HRM para resolver los problemas actuales y garantizar un uso óptimo en el entorno de TI en constante cambio.
Palabras clave: e-HRM; Sector TI; Satisfacción de los Empleados; Organización; Tecnología; Alfa de Cronbach; ANOVA.
INTRODUCTION
The industry 4.0 revolution is affecting every service sector, with the IT sector being the most heavily affected. Every IT organization in the country employs the most recent version of the software to help with staff development. Technology has always been evolving, and this has also led to changes in the role of human resources. The usage of human resources requires a complete overhaul in terms of technology and administration. Employee management, managerial initiatives, the organizational environment, and the way HR activities are delivered in the form of e-HRM have all undergone significant change as a result of these technological transformations in organizations.
The approach HR departments tackle information exchange and record keeping is evolving due to information technology. It makes a significant reduction in paperwork and facilitates the easy access to vast volumes of data. Electronic Human Resource Management (EHRM) involves the processing and dissemination of digital HR data.(1) The term e-HRMrefers to a “means of executing HR strategies, procedures, and procedures in businesses through full use of web-technology-based channels and aware and targeted assistance to them”.(2) Additionally, it gives employees and management more influence within the firm because standard HR functions may be accessed through the internet or other technological communication networks. Compared to an administrator, the position of an HR professional has become more crucial in the recent years for the economic success of the company. In essence, the work done by e-HRM is tied to the managerial HRM functions; for example, e-HRM refers to e-recruitment and e-selection. E-training and e-learning are terms used in e-HRM to describe training and learning. Performance management and compensation became e-performance management and e-compensation, respectively. Several publications have proposed definitions of e-HRM, some of which are shown in table 1.
|
Table 1. Definitions of e-HRM |
|
|
Authors (Year) |
Definitions |
|
Challapalli (2005) (3) |
“As a manner of implementing HR strategies, policies, and practices in organizations through a purposeful and directed support of and/or with the full use of web-technology-based channels.” |
|
Strohmeier (2007) (4) |
“e-HRM is the organizing, carrying out, and application of information technology for both networking and assisting at least two people or groups of people in the joint performance of HR activities.” |
|
Thite and Kavanagh (2009) (5) |
“e-HRM can be used for transactional activities (those that include regular interactions and record keeping), conventional HRM operations such as recruiting, hiring, educating, wages, and performance management, and transformational activities that bring value to the organization.” |
|
Bondarouk& Ruel (2009) (6) |
“An umbrella phrase spanning all conceivable integration mechanisms and contents between HRM and information technology, seeking to create value within and across organisations for targeted employees and management.” |
Each person uses a varied set of software depending on the nature of their employment. The HR department, for instance, uses Nakuri.com, Monster.com, and Shine.com for e-recruitment purposes. From there, they select candidates for recruitment based on their needs. The same is true with online training, where various software programs are employed to improve staff members’ competencies. The advancements in technology have made this task easier. On the other hand, separate software is used to determine e-compensation as well as e-performance appraisal. Various e-HRM practices are shown in figure 1.
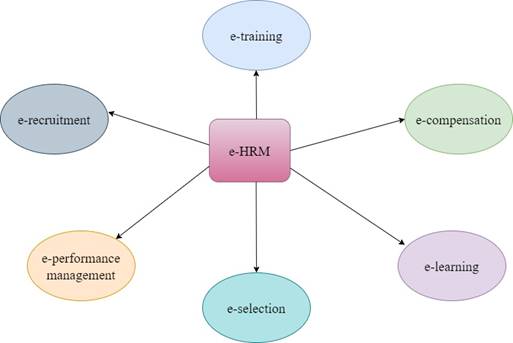
Figure 1. e-HRM Practices
HRM has been adjusting to numerous upgrades and modifications over the past decade, which has had an enormous effect on how HRM departments operate and developed a subculture within businesses. The development of the Internet and other IT tools is a boon that imposes pressure on all agencies to take advantage of its business-doing and performance-enhancing capabilities. In order to meet the increasing demands placed on them, HR departments are compelled to search for opportunities for the transfer of HR functions. These demands, or pressures, are intended to strengthen the strategic role of HR departments with a variety of conduct, such as the increased requirement for flexible solutions, the emphasis on being as environmentally friendly as possible, and the maintenance of the role as carrier issuer for managers and staff.(7)
The information technology industry has a big impact on the nation’s economic growth. By 2025, the Indian IT sector is expected to have contributed 10 % of the nation’s GDP, up from 7,7 % at the end of the previous year. It is projected that the market size of the Indian IT & BPM sector will rise. Indian IT firms are known for their global delivery centers and diverse business sectors such as retail, telecom, and BFSI. The number of new hires in the Indian IT sector increased to 205 000 in FY20 from 185 000 in FY19. Since digitalization will be a major factor in many businesses in the upcoming years, the Indian IT sector is focusing on digital potential. Additionally, India’s economy is currently digitizing at the second-fastest rate among the world’s 17 top economies.(8)
The Indian IT sector employs 884 000 skilled digital professionals as of FY19.(9) India, which has become the global center for digital capabilities, is home to around 75 % of the world’s digital talent. The nation’s digital economy is expected to be valued $1 trillion US by 2025. It is widely known that the information technology sector is the growth engine responsible for the economy’s progress. India, one of the world’s growing economies, is predicted to rank among the top three economies in the next ten to fifteen years.(10)
In the realm of information technology, new software is constantly required in order to meet employee and consumer demands. The organization provides new software updates to assist clients or staff in offering these services. Thus, e-HRM is helpful in this way because HR services are required in every firm. Employees and the organization both find work to be easier with the support of IT services. For instance, the HR department needs to conduct HRM processes such as hiring, training, paying employees, and evaluating their performance. Employee satisfaction with e-HRM in the workplace is a result of its user-friendly and clear interface. Both the company and the employee save time with e-HRM because of their hectic schedules and lack of spare time.(11)
Moving to e-HRM is a strategic decision as well as a technology adjustment to increase efficiency, improve employee experiences, and ensure the agility needed in a sector defined by innovation. This study aims to provide insightful information that can improve employee satisfaction, inform HR initiatives, and strengthen the IT sector’s resistance to technological improvements as the digital revolution transforms traditional workplace dynamics. The application of e-HRM is framed as a critical first step in coordinating HR policies with the region’s technology innovations.(12)
Literature review
The effects of e-training and development, e-selection and recruitment, and e-HR evaluation on banking performance were examined by Arshad et al.(13) The study discovered a considerable positive impact using a quantitative technique and data from e-HRM integrated financial institutions. While e-training and development increased the skill set of banking professionals, e-recruitment increased the effectiveness of talent acquisition. E-HR evaluation worked well for evaluating and enhancing worker performance. The study emphasizes how important e-HRM techniques are for maximizing HR operations in the banking industry.
The effects of e-HRM practices, particularly e-compensation and e-hiring, on organizational effectiveness in Nigeria’s banking industry was investigated by Oyoru et al.(14) The study employed Social Systems Theory in conjunction with a survey research approach to gather primary data via questionnaires. The results of multiple linear regressions conducted in SPSS v24 indicated a strong positive correlation between staff performance and e-recruitment. The study also showed a significant correlation between enhanced productivity and efficiency among employees in particular Nigerian banks and equitable e-compensation.
The impact of E-HRM deployment on HRM in Sri Lanka has been examined by De Alwis et al.(15) The results showed that although HRM was familiar with E-HR tools, E-HRM applications were less well-known, according to a study framework and qualitative methodology. The study found that while HRM places a lot of focus on administrative duties, one of the main advantages of E-HRM is the freedom from intermediary responsibilities. This shift transformed practitioners from administrative handlers to strategic analysts, allowing HRM to focus on planning.
A study by Milon et al.(16) sought to pinpoint important e-HRM practices in Bangladesh’s commercial sector. Garrett ranking was used to examine the data from 108 respondents that were gathered via a Likert scale questionnaire. The following were important e-HRM practices: e-personal profile, e-training, e-application monitoring, e-communication, e-recruitment. Adopting these techniques is advised by the study to improve HRM efficiency. The research highlights the necessity for private enterprises to adopt e-HRM technologies in order to implement strategic HRM policies, save costs, and enhance overall performance, stressing the significant costs associated with doing otherwise.
Research Gap
These days, e-HRM is being used by many Indian companies. Numerous studies have been conducted in this field. However, there is a dearth of comprehensive research on e-HRM in the IT sector of Trivandrum District. Investigating the various facets of e-HRM was essential. This led to the subsequent study, which focused on the many cutting-edge e-HRM strategies used by IT companies of Trivandrum. The study set out to find out what factors influence e-HRM, how employees felt about e-HRM practices, how such practices affected workers’ satisfaction levels, and what challenges IT organizations had while implementing e-HRM. This study will contribute to the body of scientific knowledge and provide helpful guidance to IT managers who wish to adopt e-HRM to boost their organizations’ productivity and efficiency. When all organizational tasks were transferred to the online environment during the pandemic, work efficiency was possible with the help of e-HRM. Thus, an analysis of e-HRM within the Trivandrum context was imperative.
OBJECTIVES OF THE STUDY
· To investigate how IT businesses’ employees of Trivandrum, perceive about e-HRM.
· To investigate how e-HRM strategies influence employee performance.
Proposed hypotheses
· “There is a positive relationship between the perceived impact of e-HRM on job performance and attitude towards e-HRM”.
· “There is a positive relationship between perceived user friendliness of e-HRM interfaces and attitude towards e-HRM”.
· There is a significant relationship between e-HRM practices and employees’ satisfaction.
METHOD
Conceptual Framework
The proposed study’s conceptual framework revolves around understanding the impact of e-HRM on various employee outcomes as shown in figure 2. The dependent variable, termed “Employee Outcomes,” encompasses several key aspects, including Employee Performance, Employee Satisfaction, Employee Productivity, Employee Retention, and Employee Absenteeism. The study seeks to explore how these employee outcomes are influenced by a set of independent variables related to E-HRM implementation.
Research Design
The research design is an overarching strategy that outlines the procedures and techniques for obtaining and evaluating the required data. The proposed study’s research design is primarily descriptive in nature. The study examined a variety of e-HRM techniques used in the IT business, including e-recruitment, e-training, e-compensation, and e-performance appraisal. It covered every procedure employed by IT firms. As it outlined the several elements influencing e-HRM in IT companies, this study is descriptive.
Data Collection
This study is based on primary data sources. Primary data is collected via a structured questionnaire designed in accordance with the study’s objectives. Secondary data was gathered from books, periodicals, newspapers, research papers, and online journals.
Designing of the questionnaire
This study made use of a systematic and standardized questionnaire. Each remark was graded on a five-point Likert scale as follows: strongly disagree = 1, disagree = 2, neutral = 3, agree = 4, extremely agree = 5. The questionnaire contained five sections: demographic profile; Innovative e-HRM Strategies in IT firms in Trivandrum, employee attitude toward e-HRM in IT organizations; effects of e-HRM practice on employee satisfaction level in IT organizations; factors affecting e-HRM in IT organizations; the obstacles that IT firms encounter while deploying e-HRM.
Sampling Technique
Non-Probability Sampling technique is used in this study. Specifically, convenience sampling is employed to choose IT company employees. According to the survey, there are 300 IT companies in and around the city of Trivandrum. Samples from the top five IT businesses in Trivandrum are taken from among them.
Sampling Area
Only IT companies located in Trivandrum, India’s southernmost region, were included in the study’s sample. The inclusion of IT companies in the city was considered during the selection process, with the understanding that some companies might only operate in this location and not branch out to other areas.

Figure 2. Conceptual Framework
Population
The respondents included employees from Trivandrum, with a particular emphasis on Nissan Digital India LLP, TCS, INFOSYS, EYME Technologies Pvt Ltd, and Allianz Technology SE. The IT industry was the study’s target market, and employees were given the questionnaire via email, LinkedIn, Twitter, Facebook, and WhatsApp groups in addition to in-person visits. And there was an additional choice called “other,” which included employees connected to the IT industry but not working for any of the top five businesses, like Google, Accenture, IBM, and so on. For the study, a total of 1000 questionnaires were distributed.
Sampling Unit
The sample unit for this study is employees of IT companies. This implies that every worker at the IT company has the opportunity to complete the survey. The sample unit included members from Top, Middle, Lower, Administration, HR, IT, Finance, and many more departments. The employees were classified as engineering graduates, non-engineering graduates, postgraduates, and employees with any other qualification based on their educational background. The staff members’ titles included project manager, technical lead, team leader, senior software engineer, and software engineer, among others.
Sample Size
The term “sample” refers to a portion of an entire population which is employed for assessing characteristics of the population as a whole. The number of respondents who filled out the questionnaire is referred to as the sample size. A total of 938 employee responses to the 1000 questionnaires that were given out were obtained for the data collection. Additionally, 26 replies were disregarded because some details were missing. 32 feedback were excluded from consideration because they did not meet one of the requirements, which was to evaluate responses from employees with at least a year of experience. Data analysis is conducted using 900 responds that were deemed comprehensive and appropriate in every way following validation.
Pilot Study
For the proposed study, a standardized and organized questionnaire was developed. It was given to the employees of the IT company. In the first phase, a pilot survey with 104 respondents was carried out to construct measurement instruments. There were a total of 1000 respondents in this study. Of the total data, 10 % was gathered specifically for the pilot project. The head of human resources, team leader, software engineer, senior software engineer, and technical head of the company were among the respondents.
Statistical Tools for Analysis
SPSS (Statistical Package for Social Sciences) version 21 was used in this investigation. The data were analyzed using regression, correlation, mean, and standard deviation.
RESULTS
Demographic Distribution
The demographic distribution of the proposed study is purposefully designed to include a variety of viewpoints, guaranteeing an in-depth investigation of e-HRM practices among various employee demographic groups as shown in Table 2. Descriptive statistics were employed in this research to depict the attributes of the population of the sampled individuals.
|
Table 2. Demographic Statistics |
|||
|
Demographic Factor |
Category |
Frequency |
Percentage |
|
Age |
<25 |
190 |
21,1 % |
|
25-35 |
380 |
42,2 % |
|
|
35-45 |
140 |
15,6 % |
|
|
45-55 |
140 |
15,6 % |
|
|
>55 |
50 |
5,6 % |
|
|
Gender |
Male |
660 |
73,3 % |
|
Female |
240 |
26,7 % |
|
|
Educational Qualification |
Engineering Graduates |
380 |
42,2 % |
|
Non-engineering Graduates |
170 |
18,9 % |
|
|
Post-Graduation |
350 |
38,9 % |
|
|
Others |
1 |
0,1 % |
|
|
Job position |
Software Engineer |
230 |
25,6 % |
|
Senior Software Engineer |
120 |
13,3 % |
|
|
Technical Lead |
170 |
18,9 % |
|
|
Team Lead |
150 |
16,7 % |
|
|
Project Manager |
120 |
13,3 % |
|
|
Others |
110 |
12,2 % |
|
|
Years of Experience |
0-5 |
380 |
42,2 % |
|
5-10 |
230 |
25,6 % |
|
|
10-15 |
150 |
16,7 % |
|
|
15-20 |
80 |
8,9 % |
|
|
>25 |
60 |
6,7 % |
|
|
Department |
Human Resources |
180 |
20,0 % |
|
Information Technology |
450 |
50,0 % |
|
|
Finance |
120 |
13,3 % |
|
|
Operations |
150 |
16,7 % |
|
|
e-HRM usage Frequency |
Daily |
300 |
33,3 % |
|
Weekly |
350 |
38,9 % |
|
|
Monthly |
200 |
22,2 % |
|
|
Rarely/Never |
50 |
5,6 % |
|
The age distribution shows a varied representation, with 42,2 % of the respondents falling into the 25–35 age. This suggests that viewpoints from employees in the early to mid-stages of their careers are included in the study. A wide range of experiences and perspectives is ensured by the distribution among different age groups, especially those over 55. The survey reveals that there were significantly more male participants (73,3 %) than female participants (26,7 %) in terms of gender representation. Even if there is a gender gap, it is representative of how gender is now distributed in many tech-related fields. The majority of graduates (42,2 %) have engineering degrees, followed by post-graduates (38,9 %) and non-engineering graduates (18,9 %) in terms of educational background. With a sizable percentage of the workforce having engineering degrees, this split accurately depicts the technical character of the sector. The study gains richness from the inclusion of individuals with varying educational backgrounds, since it captures a range of opinions resulting from disparate educational experiences.
The distribution of employment role shows that employees are working in a variety of abilities, and that a sizable portion of them occupy responsibilities like team lead (16,7 %), technical lead (18,9 %), and software engineer (25,6 %). A comprehensive grasp of e-HRM attitudes across all levels of responsibility within the corporate structure is ensured by this diversity of responsibilities. The participants are then divided into discrete groups according to their professional journeys by the years of experience category. A significant percentage of early-career professionals are indicated by the concentration of respondents with 0–5 years of experience (42,2 %), whilst the presence of respondents with over 25 years of experience (6,7 %) indicates the perspectives of more seasoned professionals.
Significantly, the majority of respondents (i.e., 50 %) are from the Information Technology department, suggesting that this department heavily relies on e-HRM practices. This demonstrates how important technology-driven HR management is to the IT industry and fits in with the focus on digital solutions that the sector is placing. Following with percentages of 20 %, 13,3 %, and 16,7 %, respectively, are human resources, finance, and operations. These statistics demonstrate the variety of ways that e-HRM is used across various corporate domains. The frequency of e-HRM usage reveals that a significant percentage of employees participate in these activities on a regular basis: 33,3 % of employees use e-HRM daily, and 38,9 % use it weekly. This highlights how e-HRM is consistently incorporated into daily operations and highlights how deeply ingrained it is in organizational procedures. The data also shows that a smaller portion of respondents, 5,6 %, use e-HRM infrequently or never, whereas 22,2 % use it monthly, indicating periodic participation. A thorough envision is given by this detailed understanding of departmental distribution and usage frequency, which paves the way for more research and insights into the dynamics of the organization’s e-HRM. Considering how quickly technology is developing and how it affects the workplace, this distribution helps to capture a longitudinal view of e-HRM practices.
Reliability Analysis
Cronbach’s alpha, which measures the internal consistency of a group of survey items, is a regularly used reliability metric. Table 3 shows the Reliability results obtained for employees’ perception about e-HRM. A high degree of internal consistency amongst the questionnaire items is indicated by a Cronbach’s alpha of 0,85, indicating that the items are assessing a similar construct of perceived e-HRMA value of 0,70 or above is typically considered appropriate for research purposes. Further details regarding the link between individual items and the entire scale are provided by the mean item-total correlation.
|
Table 3. Reliability Statistics |
|
|
Cronbach’s alpha |
0,85 |
|
Number of items |
14 |
|
Mean item- Total correlation |
0,68 |
Correlation Analysis
Correlation analysis is a statistical approach used to determine the direction and strength of a linear relationship between two variables. The relationships between numerous statements about attitudes and perceptions of e-HRM are shown in table 4.
|
Table 4. Correlation Analysis between perceived impact of e-HRM on job performance and attitude |
||||||||||
|
Correlations |
||||||||||
|
Statements |
A1 |
A2 |
A3 |
A4 |
A5 |
A10 |
A11 |
A12 |
A13 |
A14 |
|
A1 |
1,000 |
|
|
|
|
|
|
|
|
|
|
A2 |
0,432 |
1,000 |
|
|
|
|
|
|
|
|
|
A3 |
0,145 |
0,275 |
1,000 |
|
|
|
|
|
|
|
|
A4 |
0,398 |
0,312 |
0,185 |
1,000 |
|
|
|
|
|
|
|
A5 |
0,257 |
0,163 |
0,074 |
0,219 |
1,000 |
|
|
|
|
|
|
A10 |
0,310 |
0,288 |
0,201 |
0,345 |
0,121 |
1,000 |
|
|
|
|
|
A11 |
0,189 |
0,256 |
0,322 |
0,309 |
0,042 |
0,287 |
1,000 |
|
|
|
|
A12 |
0,135 |
0,211 |
0,188 |
0,265 |
0,304 |
0,093 |
0,175 |
1,000 |
|
|
|
A13 |
0,370 |
0,312 |
0,141 |
0,298 |
0,177 |
0,368 |
0,237 |
0,112 |
1,000 |
|
|
A14 |
0,291 |
0,245 |
0,309 |
0,274 |
0,193 |
0,392 |
0,351 |
0,158 |
0,412 |
1,000 |
|
Correlation is significant at the 0,05 level (2-tailed) |
||||||||||
A1 (Learning to operate e-HRM is a simple process) and A10 (e-HRM is an improvement over traditional HRM) (r = 0,310), A11(HR should make more use of electronic HRM) (r = 0,189), A12 (HR should not be automated any further) (r = 0,135), A13 (e-HRM is an improvement for the organization) (r = 0,370), and A14 (e-HRM is an improvement for the employees) (r = 0,291) have a positive and significant connection. This suggests those who believe e-HRM is an easy procedure to learn are more likely to feel e-HRM benefits the company and its employees, which supports hypothesis . With A10 (r = 0,288), A11 (r = 0,256), A12 (r = 0,211), A13 (r = 0,312), and A14 (r = 0,245), A2 (Customizing e-HRM to suit my needs is effortless) shows a positive and significant relationship. This supports the hypothesis by indicating that those who find it easy to customize e-HRM are more likely to have favorable sentiments toward it. With A10 (r = 0,201), A11 (r = 0,322), A12 (r = 0,188), A13 (r = 0,141), and A14 (r = 0,309), A3 (e-HRM lacks flexibility) exhibits a positive and significant relationship. This suggests that those who think e-HRM isn’t flexible enough are more likely to think it’s a good thing for the company and its employees, which validates hypothesis . With A10 (r = 0,345), A11 (r = 0,309), A12 (r = 0,265), A13 (r = 0,298), and A14 (r = 0,274), A4 (Operating e-HRM is a straightforward task) has a positive and significant connection. This shows that employees are more likely to have good attitudes regarding e-HRM and supports hypothesis if they believe running e-HRM to be simple.
As a result, the correlation analysis consistently supports hypothesis by showing a positive association between favorable attitudes toward e-HRM and perceived impacts of e-HRM. Described here at table 5.
|
Table 5. Correlation Analysis between perceived user friendliness of e-HRM interfaces and attitude |
|||||||||
|
Correlation |
|||||||||
|
Statements |
A6 |
A7 |
A8 |
A9 |
A10 |
A11 |
A12 |
A13 |
A14 |
|
A6 |
1,000 |
|
|
|
|
|
|
|
|
|
A7 |
0,315 |
1,000 |
|
|
|
|
|
|
|
|
A8 |
0,282 |
0,235 |
1,000 |
|
|
|
|
|
|
|
A9 |
0,345 |
0,210 |
0,321 |
1,000 |
|
|
|
|
|
|
A10 |
0,289 |
0,311 |
0,275 |
0,335 |
1,000 |
|
|
|
|
|
A11 |
0,303 |
0,341 |
0,299 |
0,209 |
0,315 |
1,000 |
|
|
|
|
A12 |
0,136 |
0,159 |
0,217 |
0,161 |
0,082 |
0,175 |
1,000 |
|
|
|
A13 |
0,235 |
0,155 |
0,265 |
0,432 |
0,327 |
0,218 |
0,121 |
1,000 |
|
|
A14 |
0,376 |
0,285 |
0,321 |
0,359 |
0,382 |
0,362 |
0,135 |
0,328 |
1,000 |
Correlation is significant at the 0,05 level (2-tailed)
With A10 (r = 0,289), A11 (r = 0,303), A12 (r = 0,136), A13 (r = 0,235), and A14 (r = 0,376), A6 (Using e-HRM enhances the calibre of my work) shows a positive connection. This shows that employees are more likely to have good attitudes on e-HRM if they believe that utilizing it improves the quality of their job. With A10 (r = 0,311), A11 (r = 0,341), A12 (r = 0,159), A13 (r = 0,155), and A14 (r = 0,285), A7 (e-HRM allows me to complete my tasks efficiently) exhibits positive relationships. This suggests that employees are more likely to have good opinions toward e-HRM if they feel that it helps them do tasks efficiently. The values of A8 (The utilization of e-HRM enhances my individual efficiency) and A10 (r = 0,275), A11 (r = 0,299), A12 (r = 0,217), A13 (r = 0,265), and A14 (r = 0,321) show positive relationships. According to this, employees are more likely to have favorable attitudes toward e-HRM if they believe it improves their own productivity. A9 (It is useful to use e-HRM) has a positive correlation with A10 (r = 0,335), A11 (r = 0,315), A12 (r = 0,161), A13 (r = 0,432), and A14 (r = 0,359). This shows that good attitudes toward e-HRM are more common among those who find utilizing it useful.
The perceived user-friendliness of e-HRM interfaces, as reflected in statements A6 to A9, is positively associated with positive attitudes toward e-HRM. Individuals who perceive e-HRM as enhancing their work caliber, allowing efficient task completion, improving individual efficiency, and being useful are more likely to have favorable attitudes toward e-HRM. Thus, both the hypothesis and were accepted because of existence of significant and positive correlation.
Regression Analysis
Regression analysis is a statistical method used to determine the relationship between one or more independent variables and one or more dependent variables. The goal is to estimate the coefficients of the regression equation in order to represent the dependent variable’s dependence on the independent variables for the impact of e-HRM tactics on employee performance. The regression analysis in Table 6 examines the link between various e-HRM components (predictors), such as e-recruitment, e-training, e-compensation, and e-performance assessment, and the dependent variable, which is client satisfaction. Illustrated here at table 6.
The coefficient of determination is a critical metric for understanding how much of the variation in the satisfaction variable can be accounted for by the e-HRM predictors (). In this instance, the R2 value of 0,688 shows that the variables in the model related to e-recruitment, e-training, e-compensation, and e-performance appraisal can explain roughly 68,8 % of the variability in satisfaction. This shows that the predictors and the satisfaction result have a rather strong relationship. The model’s adjusted , which takes into account the number of predictors and model complexity, is 0,675. This adjusted value provides a more realistic representation of the model’s explanatory capacity while also aiding in the prevention of overfitting. The Std. Error of the Estimate (0,31254) represents the average difference between actual and expected values, indicating how effectively the model predicts satisfaction using e-HRM components.
|
Table 6. Regression Analysis |
||||
|
Model Summary |
||||
|
Model |
R |
|
Adjusted |
Std. Error of the estimate |
|
1 |
0,830a |
0,688 |
0,675 |
0,31254 |
|
a. Predictors: (Constant), efficiency, recruitment cost, online payslips, applicant search, modifying employee behaviour, salary calculation, transparency, employees’ knowledge, poor performance, faster hiring, maintaining current knowledge, administrative burden, enhances employees’ skills, effective salary administration system, performance related pay effectively, pay structure, easy to use, recognition and development of individual talents, higher level of motivation. |
||||
ANOVA
Analysis of Variance (ANOVA) is a statistical technique used to examine if the means of two or more groups differ significantly. To explore the association between e-HRM practices and employee satisfaction, the dependent variable, employee satisfaction (Y), is measured based on these practices. ANOVA is performed to see if employee satisfaction scores change substantially between e-HRM practic levels.
|
Table 7. ANOVA Results |
|||||
|
ANOVAa |
|||||
|
Model |
Sum of Squares |
df |
Mean Square |
F |
Sig |
|
Regression |
245,67 |
20 |
9,321 |
87,321 |
0,000b |
|
Residual |
112,45 |
917 |
0,104 |
|
|
|
Total |
358,12 |
937 |
|
|
|
|
a. Dependent Variable: Satisfaction |
|||||
|
b. Predictors: (Constant), efficiency, recruitment cost, online payslips, applicant search, modifying employee behaviour, salary calculation, transparency, employees’ knowledge, poor performance, faster hiring, maintaining current knowledge, administrative burden, enhances employees’ skills, effective salary administration system, performance related pay effectively, pay structure, easy to use, recognition and development of individual talents, higher level of motivation. |
|||||
ANOVA results in Table 7 indicate a significant relationship between e-HRM practices and employees’ satisfaction (F (20, 917) = 87,321, p < 0,001). The regression’s significant sum of squares (245,67) in relation to the residual sum of squares (112,45) highlights how well the model explains the variance in employee satisfaction. For regression, the average variability in satisfaction attributable to the variables is represented by the mean square (9,321). The relevance of the model is further supported by the F-statistic of 87,321, which shows that there is no chance explanation for the observed association between e-HRM practices and satisfaction. This all-inclusive model emphasizes the significance of numerous elements, from hiring procedures to performance-related compensation and recognition, and collectively advances a more nuanced understanding of the complex impact of e-HRM practices on employee satisfaction.
DISCUSSIONS
In order to provide a varied representation of opinions, the proposed study uses a thorough demographic distribution to explore the challenging landscape of e-HRM practices within the IT industry. Table 2’s demographic profile, which includes age groups, gender, educational backgrounds, job titles, and years of experience, offers a detailed overview of the ways in which different employee traits interact with e-HRM perceptions. The study notably reflects the gender distribution that is common in tech-related areas, reflecting the present dynamics of the business. Strong internal consistency in evaluating employees’ impressions of e-HRM is indicated by the reliability analysis, which is illustrated in Table 3 and has a high Cronbach’s alpha of 0,85. Strong relationships between favorable opinions about e-HRM and reported impacts are further highlighted by correlation analysis, highlighting the study’s resilience. With an astounding value of 0,688, the regression analysis—which is presented in Table 6 provides insights into the predictors’ impact on employee satisfaction.
CONCLUSION
The proposed study has provided significant novel insights about e-HRM and its significant effects on the IT industry. The extensive analysis of 900 participants from a range of demographic backgrounds has yielded a refined comprehension of the ways in which e-HRM practices are ingrained in the IT sector. The industry’s reliance on cutting-edge technologies is confirmed by the high percentage of employees under 35 and engineering graduates, which highlight the workforce’s youthful and technically oriented character.
The study is significant since it adds to the understanding of how e-HRM practices affect the attitudes and satisfaction levels of the IT personnel. The findings highlight the necessity of strategic improvements in e-HRM practices as firms struggle with the ever-changing technological landscape and its effects on HR activities. Through the identification of subtle demographic differences and their correlation with perceptions of e-HRM, firms can customize their strategies to better meet the varied needs of their workforce. In essence, this study recommends that e-HRM methods in the IT industry continue to develop in order to stay flexible enough to accommodate the workforce’s shifting demands and preferences. The findings highlight the necessity for companies to allocate resources towards intuitive interfaces and stress the comprehensive amalgamation of electronic hiring, e-training, e-compensation, and e-performance evaluation in order to maximize employee satisfaction as well as performance.
REFERENCES
1. Nenwani PJ, Raj MD. E-HRM prospective in present scenario. International Journal of advance research in computer science and management studies. 2013 Dec;1(7):422-8.
2. Looise JK, Paauwe J. HR research in the Netherlands: imitation and innovation. International Journal of Human Resource Management. 12(7), pp. 1203-17. https://doi.org/10.1080/09585190110068403
3. Challapalli, S. (2005). Those grand job ads, Business line, 31(1).
4. Strohmeier, S. (2007). Research in e-HRM: Review and implications, 17, pp. 19–37. http://doi.org/10.1016/j.hrmr.2006.11.002
5. Kavanagh MJ, Thite M, Johnson RD. The future of HRIS: emerging trends in HRM and IT. Human Resource Information Systems: Basics, Applications, and Future Directions, California: SAGE Publications Inc. Pp. 409-18.
6. Bondarouk TV, Ruël HJ. Electronic Human Resource Management: challenges in the digital era. The international journal of human resource management. 20(3), pp. 505-14. https://doi.org/10.1080/09585190802707235
7. Lepak DP, Snell SA. Virtual HR: Strategic human resource management in the 21st century. Human resource management review. 8(3), pp. 215-34. https://doi.org/10.1016/S1053-4822(98)90003-1
8. IBEF (2020). https://www.ibef.org/
9. Statisticstimes, 2019. https://statisticstimes.com/index.php
10. Andrlić B, Hak M, Balakrishnan B. The Impact of e-HRM on Organisational Citizenship Behaviour–A Study Outlined in the IT Sector. In14th International Odyssey Conference on Economics and Business 2023, pp. 18-25.
11. Khammadee P. The relationship between E-HRM practices and organizational performance: the mediating role of organizational agility and sustainable competitive advantage. Asian Administration & Management Review. 6(1). https://dx.doi.org/10.2139/ssrn.4546511
12. Nurimansjah RA, Nurjannah N, Munawir M, Basalamah J. The Moderating Role of HR Service Quality Between e-HRM and Employee Performance. Jurnal Manajemen Bisnis. 10(1), pp. 98-108. https://doi.org/10.33096/jmb.v10i1.477
13. Arshad M, Abbas K, Gul M. Examining the Influence of E-HRM Practices on Conventional Banks’ Performance: A Focus on E-Recruitment, E-Training, and E-HR Evaluation. Contemporary Issues in Social Sciences and Management Practices. https://doi.org/10.61503/cissmp.v2i2.36
14. Oyoru RA. Effect of E-HRM Practices on Organizational Performance: A Study of the Banking Industry in Nigeria. Journal of Public Administration, Policy and Governance Research. 1(1), pp. 84-97.
15. De Alwis AC, Andrlić B, Šostar M. The Influence of E-HRM on modernizing the role of HRM context. Economies. 10(8), pp. 181. https://doi.org/10.3390/economies10080181
16. Milon M, Alam MA, Pias MH. Exploring the key practices of E-HRM in place of traditional HRM: A study on private industry of Bangladesh. Journal of Human Resource and Sustainability Studies. 10(3), pp. 403-17. https://doi.org/10.4236/jhrss.2022.103024
FINANCING
The authors did not receive financing for the development of this research.
CONFLICT OF INTEREST
The authors declare that there is no conflict of interest.
AUTHORSHIP CONTRIBUTION
Conceptualization: Anu P John.
Data curation: Anu P John.
Formal analysis: Anu P John.
Research: Velmurugan V.P.
Methodology: Velmurugan V.P.
Drafting - original draft: Anu P John.
Writing - proofreading and editing: Velmurugan V.P.