doi: 10.56294/sctconf2024.1212
ORIGINAL
Reasons for capital increase of securities brokers
Razones del aumento de capital de los corredores de valores
Tran Van Hai1
![]() *, Le Thi Lan1
*, Le Thi Lan1
![]() *
*
1Hanoi Open University. Hanoi, Vietnam.
Cite as: Van Hai T, Thi Lan L. Reasons for capital increase of securities brokers. Salud, Ciencia y Tecnología - Serie de Conferencias. 2024; 3:.1212. https://doi.org/10.56294/sctconf2024.1212
Submitted: 13-03-2024 Revised: 22-07-2024 Accepted: 08-10-2024 Published: 09-10-2024
Editor:
Dr.
William Castillo-González ![]()
Corresponding Author: Tran Van Hai *
ABSTRACT
Introduction: the study uses a linear regression model based on Pooled OLS, FEM, REM, GLS panel data to examine the impact of financial capacity on sustainable growth in order to create more grounds for evaluating the financial capacity of Vietnamese securities companies.
Method: the study excludes newly established or merged companies whose financial data do not ensure comparability and those that do not disclose sufficient information required for the study. The research uses a linear regression model based on panel data to test the impact of financial capacity on sustainable growth, thereby providing a basis for evaluating the financial capacity of Vietnamese securities companies.
Results: results show evidence identifying 8 independent variables explaining 89,2 % of the variation in the dependent variable (SGR), including: Size of the securities company (Size); Self-financing ratio (SFA); Debt to equity ratio (Leverage); Return on equity (ROE); Return on total assets (ROA); Additional capital from profit ratio (RER); and Capital adequacy ratio (Caps).
Conclusions: based on the research, the author offers recommendations for managers of securities companies in making financial decisions.
Keywords: Securities Company; Financial Capacity; Performance Efficiency.
RESUMEN
Introducción: el estudio utiliza un modelo de regresión lineal basado en datos de panel agrupados OLS, FEM, REM y GLS para examinar el impacto de la capacidad financiera en el crecimiento sostenible con el fin de crear más bases para evaluar la capacidad financiera de las compañías de valores vietnamitas.
Método: el estudio excluye empresas de nueva creación o fusionadas cuyos datos financieros no garantizan la comparabilidad y aquellas que no revelan la información suficiente requerida para el estudio. La investigación utiliza un modelo de regresión lineal basado en datos de panel para probar el impacto de la capacidad financiera en el crecimiento sostenible, proporcionando así una base para evaluar la capacidad financiera de las compañías de valores vietnamitas.
Resultados: los resultados muestran evidencia que identifica 8 variables independientes que explican el 89,2 % de la variación de la variable dependiente (SGR), entre ellas: Tamaño de la sociedad de valores (Size); Ratio de autofinanciamiento (SFA); Relación deuda-capital (apalancamiento); Rentabilidad sobre el capital (ROE); Retorno sobre activos totales (ROA); Ratio capital adicional a partir de beneficios (RER); y Índice de adecuación de capital (Caps).
Conclusiones: con base en la investigación, el autor ofrece recomendaciones para los gerentes de compañías de valores en la toma de decisiones financieras.
Palabras clave: Sociedad de Valores; Capacidad Financiera; Eficiencia en el Desempeño.
INTRODUCTION
The stock market (SM) symbolizes the modern economy and is a crucial channel for medium and long-term capital for the economy. The history of stock market development worldwide has experienced ups and downs associated with many financial crises, such as the South Sea Bubble in England in 1711, the U.S. crisis in 1929, and the recent subprime mortgage crisis in the U.S. from 2007-2009. Notably, large investment banks like Lehman Brothers, which was the fourth largest securities and investment bank in the U.S. with headquarters in New York and branches in London and Tokyo, went bankrupt in August 2008, followed by a series of other companies in the same field. This crisis led to the U.S. Senate passing the Emergency Economic Stabilization Act of 2008, allowing the Treasury Secretary to spend up to $700 billion to stabilize the financial system by purchasing troubled assets. Key elements of these crises include credit activities (bad debt), securities (securitization), and real estate, with the involvement of investment banks and securities brokers. The lesson for businesses, including securities companies, is that despite large scale and high growth, they can still go bankrupt if growth is not sustainable.
In Vietnam, the stock market started in 2000 with few securities companies, but it quickly grew in number and quality. From 5 companies in 2000, the number increased to 78 by 2007 and to 105 by 2009. However, this rapid growth has revealed limitations leading to unsustainable development. By October 2021, the number of securities companies had decreased to about 70. The reduction in number is due to the harsh market economy and, importantly, the low financial capacity of securities companies. Statistics show that 37 companies have equity below 500 billion VND, accounting for 52,86 %; 11 companies have equity between 500 billion and 1000 billion VND, accounting for 15,71 %; and only 22 companies have equity over 1000 billion VND, accounting for 31,43 %. Companies with equity below 250 billion VND are limited in their business activities and cannot fully participate in the market. Low financial capacity hinders companies from improving service quality, introducing new products, expanding branches, investing in technology, and expanding the market, posing a risk to the system’s safety and affecting the interests of investors, partners, and customers.
The development history of Vietnamese securities companies is linked with the stock market’s growth. When the Vietnamese stock market officially started in July 2000, there were only 5 securities companies, formed by banks and financial groups such as the Bank for Investment and Development of Vietnam, Industrial and Commercial Bank of Vietnam, Foreign Trade Bank, Military Bank, and Bao Viet Financial Group. During 2006-2009, the stock market experienced significant growth, increasing the number of securities companies to 105 by the end of 2009.
Initially, these companies met market demands, but rapid growth and market competition challenges led to many companies ceasing operations, dissolving, merging, or restructuring. Consequently, the number of securities companies reduced to 84 by the end of 2013 and to 70 by the end of 2020 (excluding foreign companies like Maybank Kim Eng, Mirae Asset, RHB, Shinhan, Yuanta, NH, JAPAN, JB, and KB).
Despite the reduction in number, compared to market size and regional countries, the number of Vietnamese securities companies remains high. By September 30, 2021, the market capitalization was 6861 trillion VND (equivalent to 298 billion USD), with 79 active securities companies (9 foreign). In Japan, with a market capitalization of 5,67 trillion USD (as of February 2019), there are 104 securities companies (94 domestic and 10 foreign). In Singapore, with a market capitalization of 733,27 billion USD, there are 776 listed companies and 78 securities companies. This increases competition, favoring companies with large capital and weakening the financial capacity of smaller companies due to reduced profitability.
Moreover, the distribution network of securities companies is uneven, primarily concentrated in major cities like Ho Chi Minh City and Hanoi, with a few in Da Nang, Binh Duong, Vung Tau, and Nghe An but on a small scale. This also affects the operational efficiency of Vietnamese securities companies.
According to the Securities Law No. 54/2019/QH14 issued on November 26, 2019, securities companies are licensed to conduct one or more business activities: securities brokerage, proprietary trading, underwriting, and investment advisory. A company must be licensed for brokerage to be allowed proprietary trading and for proprietary trading to be allowed underwriting. Each business activity has specific conditions stipulated in Article 175 of Decree No. 155/2020/ND-CP dated December 31, 2020, such as a minimum charter capital of 25 billion VND for brokerage, 50 billion VND for proprietary trading, 165 billion VND for underwriting, and 10 billion VND for investment advisory. Additionally, companies can manage trading accounts, provide financial consulting, and other financial services as per the Ministry of Finance regulations or engage in derivative securities according to Decree No. 158/ND-CP dated December 31, 2020. To participate in derivative securities, companies must meet capital requirements: a minimum charter capital and equity of 800 billion VND for derivative brokerage, 600 billion VND for proprietary trading, and 250 billion VND for investment advisory. For all three activities, the minimum is 800 billion VND.
The Status of Business Activities of Vietnamese Securities Companies is as follows:
|
Table 1. Number of Securities Companies Engaging in Business Activities as of December 2020 |
|||
|
No. |
Business Activities |
Number of securities (companies) |
Density (%) |
|
1 |
Securities Brokerage, Securities Investment Consultancy, Securities Proprietary Trading, Securities Underwriting |
36 |
51,43 |
|
2 |
Securities brokerage; Securities investment consulting; Proprietary securities trading |
21 |
32,31 |
|
3 |
Securities brokerage; Securities Investment Consulting |
13 |
18,57 |
|
Total |
70 |
100 |
|
As of December 2020, the number of securities companies (SCCs) engaging in all four business activities accounted for 51,43 %. This indicates that SCCs are increasingly improving their financial capacity to engage in various business activities to meet the diverse needs of the market, thereby enhancing business performance. However, SCCs simultaneously engaging in activities such as securities brokerage and proprietary trading may face conflicts of interest, adversely affecting their brand reputation. The number of SCCs engaging in two activities, namely securities brokerage and investment advisory, accounted for a small proportion of 18,57 %. These are small-scale SCCs with limited equity, such as CVS (equity of 10 billion VND), KS (equity of 25 billion VND), and SJSC (equity of 32 billion VND).
Some SCCs, thanks to their substantial financial capacity, have ventured into derivative securities trading, including SSI, BIDV Securities Company (BSI), Artex Securities (ART), Tan Viet Securities (TVSI), and Rong Viet Securities (VDS). This activity increases liquidity and significantly boosts profits for these SCCs.
Operational Area: Although the number of SCCs is large, their network and branches are mainly concentrated in major cities like Hanoi and Ho Chi Minh City, with a few in Hai Phong, Da Nang, Vung Tau, etc., resulting in uneven distribution. SCCs with extensive operational areas include Vndirect Securities, which has 6 branches (in Ho Chi Minh City, Da Nang, Vinh – Nghe An, Can Tho, Binh Duong, and Nam Dinh) and 2 trading offices; MB Securities with 7 branches (in Ho Chi Minh City, Hanoi, and Hai Phong); and An Binh Securities with 7 branches (in Ho Chi Minh City, Hue, Hai Phong, Da Nang, Thai Binh, Bac Ninh, and Vung Tau). These SCCs have the advantage of accessing potential markets, increasing the opportunity to conveniently and quickly provide customer services, helping SCCs expand and capture market share, thereby enhancing their image and position. This, in turn, increases revenue, profits, and financial capacity, boosting the SCCs’ competitiveness in the market.
Therefore, this paper aims to delve into examining the current state of financial capacity of Vietnamese SCCs through a system of financial indicators, evaluating their achievements and limitations in terms of financial capacity.
Literature Review
IOSCO study, International Organization of Securities Commissions (1998), “Methodologies for Determining Minimum Capital Standards for Internationally Active Securities Firms Which Permit the Use of Models Under Prescribed Conditions”.(10) The methodology for determining the minimum capital standard for internationally operating securities allows the use of the conditional model according to standard 21 and standard 22. And at the same time IOSCO promulgated the objectives and principles of the Securities Regulation in May 2003, the protection of investors and the stability of the financial system are enhanced by the full supervision of capital objectives. Capital standards allow securities to be able to withstand some losses, especially in the event of major adverse market fluctuations, and achieve an environment in which securities cease business for a short period of time without affecting or causing losses to customers. not to disrupt the orderly operation of the financial market. From IOSCO’s point of view, securities with sufficient capital will not affect customers, investors, and partners, which means that if the securities company has sufficient capital, it will have the capacity to achieve other goals of the securities manager. The principles for market intermediaries, mainly securities companies, include 4 principles:
Principle 21: regulation should provide minimum entry standards for market intermediaries.
Principle 22: initial and ongoing capital is required Other prudential requirements for market intermediaries reflect the risks that intermediaries undertake.
Principle 23: market intermediaries need to comply with internal organizational and behavioral standards to protect the interests of their clients, ensure proper risk management, and accordingly initially manage intermediaries who accept responsibility for these matters.
Principle 24: it is necessary to have a troubleshooting process of a market intermediary to minimize losses and losses for investors and limit systemic risks.
Thus, the principles set forth by IOSCO are the first and most important standards of capital capacity, capital adequacy and as a result, ensuring the payment requirements of the securities company.
Basel Agreement: prior to 1987, the capital standards that banks had to comply with varied from country to country, which gave some banks a global competitive advantage over other competitors.(30) For example, let’s say a bank in the U.S. has to comply with a capital requirement of 6 %, which is twice as high as that of a foreign bank. The reason is that because governments are increasingly able to support their banks, low capital ratios are not necessarily risky, and U.S. banks do not have this advantage. In December 1987, 12 developed countries attempted to address this difference by introducing uniform standards for banks. In July 1988, the central bank governors of the 12 countries adopted the standards of the Basel Agreement. For the capital adequacy ratio, as recommended by the Basel Committee of the Bank for International Settlements (BIS), a benchmark board has been issued, including Basel I (1988) which provides for the measurement of credit risk with a minimum capital standard of 8 % of total assets with risk conversion. Basel II (2004) requires banks to maintain a minimum capital ratio of 4 % for tier 1 capital and 8 % for tier 2 capital, and at the same time supervise the operation of financial institutions based on three pillars, pillar 1 is CAR (quotient of equity capital and total assets at risk), Pillar 2 is Strengthening the assessment of the bank’s risk management quality, pillar 3 is Supervision of compliance with market discipline. Basel III (2010) sets minimum standards higher than Basel I and Basel II, the CAR coefficient remains the same but requires banks’ equity to be raised from 4 % to 6 %, of which 4,5 % must be the capital of ordinary shareholders. Especially in the Basel III standard (2010), there is an addition of securities companies.
Higgins(32): How much growth can a firm afford? The researcher developed a sustainable growth model (SGR) and came up with four financial indicators that affect sustainable growth including: dividends, profit margins, asset turnover and capital structure.
Ilm et al.(36): Sustainable Growth Rate and Optimal Capital Structure. Daffodil International University. Study on the ratio of D/E (Debt/Equity) to Sustainable Growth (SGR). The researcher’s results found that as the D/E ratio increases, the SGR also increases, and at a level of the D/E ratio, the SGR reaches its maximum, the optimal level of the D/E ratio or the optimal capital structure can be determined from the proposed continuous SGR-D/E Ratio. This is a new approach to determining the optimal D/E ratio in financial management. Experimental testing supports the findings of this study. It is suggested that financial capacity has an impact on the sustainable growth of the company, but this impact is limited, and the growth rate minus the Debt/Equity ratio is optimal.
Amouzesh et al.(35): Sustainable growth rate and firm performance: Evidence from Iran Stock Exchange. The study sample of 54 companies listed on the Iranian financial market between 2006 and 2009 looked at the correlation between the deviation of the actual growth rate and the sustainable growth rate and the return on assets (ROA), the current liquidity ratio. The results of the study show that the deviation of the actual growth rate from the sustainable growth rate has a relationship with ROA and no relationship with the current liquidity ratio.
Thantawi(20): Life-cycle theory and free cash flow hypothesis: Evidence from dividend policy in Thailand. Using a sample of Thai listed companies in the five-year period 2002-2008, to study retained earnings on equity (sustainable growth) and dividend policies, the results of the study showed that companies with higher profits, higher free cash flow, and retained earnings on equity tended to pay higher dividends. Suggesting sustainable growth has a positive relationship with corporate dividend payments.
Huang et al.(31): Research on the financial sustainable growth of the listed companies on GEM. The team of researchers empirically analyzed the current state of financial sustainability growth of GEM listed companies and the key factors that may affect sustainable growth. The results of the study on factors affecting the sustainable growth of enterprises including profitability, ability to generate money, ability to repay debts, and operational capacity.
Asgar et al.(34): The relationship between firm’s growth opportunities and firm size on changes ratio in retained earnings of listed companies in Tehran Stock Exchange. The study sample, which included 101 companies listed on the Tehran Stock Exchange between 2006 and 2011, studied the relationship between growth and business size based on the rate of change in retained earnings of companies listed in Tehran. The result is an inverse relationship between the company’s growth opportunities and the rate of change in the retained earnings ratio, and at the same time a direct and meaningful relationship between the size of the company and the change in the retained earnings ratio. i.e. a favorable relationship.
Hafid(33): The effect of margin profit and total assets towards sustainable growth rate of the distributor and trade company. The study looked at the company’s sustainable growth rate over 5 years (2010-2014), using individual component analysis, the authors conducted a regression analysis and correlation analysis. The results of the study show that the factors that make the company’s profit gradually decrease due to the composition of the cost of goods sold and other expenses are increasing. The correlation between the variable (ROL) reflected in the profit margin and the Return on Total Assets (TATO) generally affects the company’s Sustainable Growth Rate (SGR) shows a close correlation between them.
Mukherjee et al.(27): Sustainable growth rate and its determinants: a study on some selected companies in India. The study used a sample for a period of 5 years, i.e., the period from 2010-11 to 2014-15. And to examine the relationship between liquidity (Cash Flow Ratio), profitability and leverage and the company’s sustainable growth rate. The results of the study show that there is a significant positive relationship of liquidity, profitability and leverage with the sustainable growth rate of the company.
Junaidi et al.(9): Liquidity, asset quality, and efficiency to sustainable growth rate for banking in Indonesia stock exchange. The study of factors influencing sustainable growth (SGR) of banks with a study sample of 22 banks with the study period 2012-2107. Negative relationship results (SGR) include liquidity as loan-to-financing ratio (LFR), asset quality as non-performing loans (NPL) and performance by Operating Cost of Operating Income (BOPO) for SGR.
Rubunda et al.(23): The Influence of Retained Earnings and Equity Finance Structure on the Growth of Small and Medium Manufacturing Enterprises in Rwanda. Study the effect of retained earnings and equity financial structure on business growth in Rwanda. With a sample of 868 small and medium-sized enterprises (273 observations were selected), the data was taken from 11 in 2017. The results show that the equity financial structure has a positive and significant impact on growth, while the profit structure retains the result that the influence is negligible.
Nugroho(25): Sustainable Growth Rate Model in Indonesia Manufacturing Firms. Study on sustainable growth rates in Indonesia with a sample of listed companies in Indonesia from 2011 to 2019. The results show that return on equity (ROE) is the only factor affecting sustainable growth (SGR).
Akhtar et al.(18): Impact of financial leverage on sustainable growth, market performance, and profitability. The study measured the impact of financial leverage on sustainable growth (SGR) of 424 Pakistani non-financial listed companies between 2001–2017. Three measures of financial leverage, i.e., short-term debt (STDL), long-term debt (LTDL), and total debt (TLEVR), were applied to consider their impact on operational efficiency, i.e., sustainable growth (SGR). The results have a significant negative impact of financial leverage on sustainable growth. The results show that (STDL) is a major source of debt that contributes to higher refinancing risks for companies and therefore negatively affects performance.
Mubeen et al.(28): Sustainable Growth of Nonfinancial Firms: An Empirical Examination of Emerging Economies. The team of researchers used regression analysis data that had been conducted and a team of seven emerging countries over 16 years between 2000 and 2015, to find the average difference in sustainable growth between secondary equity issuers and non-issuers. As a result, enterprises with secondary equity problems are more likely to grow sustainably than businesses without secondary equity problems. Company-specific factors that are important for evaluating the SGR (Sustainable Growth Rate) model include leverage and scale, while dividend and profit policies give different results.
METHOD
The data used by the author is secondary data, taken from page (Vietstock.vn), from the annual reports of securities companies and the General Statistics Office (Gso.gov.vn). The dataset includes financial statements of Vietnamese securities in the period 2013 – 2020, the study will exclude newly established or consolidated securities that make financial data uncomparable, and securities companies do not disclose enough necessary information in the study. Follow(16) when analyzing a model with a linear structure, the sample size is calculated according to the formula n=5*2i (i is the observed variable in the model). According to Tabachnick and Fidell (2007) the sample size in multiples linear regression analysis is calculated according to the formula n= 50 + 8q (q is the number of independent variables in the model).
Data cleaning: before conducting data analysis, the author supplements and adjusts the parameters of the variables to ensure that the data processing results faithfully reflect the research object. Concrete:
· Step 1: after entering the data into the excel version, the author checks the abnormal signs of the data. Then, calculate the value of the study variables.
· Step 2: add and adjust the missing value in the following ways: (1) leave it as is, when analyzing the software, it assigns the default missing value by itself; (2) assigning the missing value to the mean or median; (3) assigning the missing value to 0.
· Step 3: analyze the correlation of each pair of variables separately to detect data errors in case the analysis results cannot be explained. Eliminate data that falsifies the relationship of variables in case of external signs of data.
Method: STATA 14 software is used to analyze the selection of regression models, test and estimate the regression model of array data. For array data, regression can be carried out in 3 methods: Pooled Ordinary Least Square Regression (Pooled OLS), Fixed-Effects Model, Covariance model, Within Estimator, Individual Dummy Variable Model, Least Squares Dummy Variable Model- Fem), Random Effects Regression (Radom-Effects Model, Random Intercept, Partial Pooling Model-Rem), hausman test experiment, to select the appropriate model from 3 models. The selected model continues to be tested for defects and corrected for defects in the model.
Selection of variables in the model
The variables are expressed in the form of panel data with two dimensions: the time dimension (from 2013 to 2020), the spatial dimension is the securities.
The dependent variable is Sustainable Growth (the SGR variable is measured by the ratio of Return on Reinvestment/Equity at the beginning of the period), the independent variables are the SGR of the stock company.
|
Table 2. Statistics of variables in the model, variable names and symbols, calculation formulas |
||||
|
No. |
Variable names and symbols |
Calculation formula |
Research |
|
|
Dependency Variable: Sustainable Growth (SGR) |
||||
|
Independent variables: |
||||
|
1 |
Size of the stock company |
Ln (Total Assets) |
(17,12,14,29,6,21,11,28,24) |
|
|
2 |
Self-Financing Factor (SFA) |
Equity/ Total Capital |
(6,3,1,4,22,26) |
|
|
3 |
Debt to Equity Ratio (Leverage) |
Total Debt/Equity |
(37,36,32,28,8,19) |
|
|
4 |
Short-term debt ratio (Stdta) |
Current Liabilities/Liabilities |
(3) |
|
|
5 |
Short-term asset investment ratio (Investment) |
Short-Term Assets/Total Assets |
(5,3,22) |
|
|
6 |
Inefficiency |
Operating expenses/net revenue |
(31,33,9,7,13,5,2) |
|
|
7 |
Margin Loan Balance |
Margin Loan Balance/Equity |
(9) |
|
|
8 |
Ratio of available capital (Caps) |
Available Capital/Total Risk Value |
(22,4,2) |
|
|
9 |
Ratio of Receivables |
Accounts receivable / Total assets |
(4) |
|
|
10 |
Solvency (CR) |
Short-term assets/Short-term liabilities |
(35,8,31,27,37,19,5,22,4,2,1,24) |
|
|
11 |
Return on assets (ROA) |
Profit after tax / Average total assets |
(15,25,33,27,22,5,31,2,19,24,26,32) |
|
|
12 |
Return on Equity (ROE) |
Profit after tax/ Average Equity |
(32,20,8,31,33,27,7,25,19,5,22,4,2,24) |
|
|
13 |
Return on capital (RER) |
Retained Earnings/Total Assets |
(32,20,8,17,23,24) |
|
|
14 |
Age of the stock company (Age) |
Ln (Year of data – Year of establishment) |
(26) |
|
Research hypotheses
· Hypothesis H01: the size of securities (Size) is correlated in the same direction with the sustainable growth of securities (SGR).
· Hypothesis H02: self-financing coefficient (Sfa) is correlated in the same direction with sustainable growth of securities (SGR).
· Hypothesis H03: debt-to-equity ratio (Leverage) is correlated in the same direction with sustainable growth of securities (SGR).
· Hypothesis H04: short-term debt ratio (Stdta) is correlated in the same direction with sustainable growth of securities (SGR).
· Hypothesis H05: the ratio of short-term asset investment (Investment) is correlated in the same direction with the sustainable growth of securities (SGR).
· Hypothesis H06: inefficiency is correlated with sustainable growth of securities (SGR).
· Hypothesis H07: margin loan balance is correlated in the same direction with sustainable growth of securities (SGR).
· Hypothesis H08: solvency (Cr) is correlated in the same direction with sustainable growth of securities (SGR).
· Hypothesis H09: return on assets (ROA) is correlated in the same direction with sustainable growth of securities (SGR).
· Hypothesis H10: return on equity (ROE) is correlated in the same direction with sustainable growth of securities (SGR).
· Hypothesis H11: the ratio of receivables is correlated in the same direction with the sustainable growth of securities (SGR).
· Hypothesis H12: the capital replenishment ratio (RER) is correlated in the same direction with the sustainable growth of securities (SGR).
· Hypothesis H13: the ratio of available capital (Caps) is correlated in the same direction with the sustainable growth of securities (SGR).
· Hypothesis H14: the age of the stock company (Age) is correlated in the same direction as the sustainable growth of the stock company (SGR).
The research model is in the form of: SGR = b0 + b1*Sizeit1 + b2*Sfait2 + b3*Leverageit3 + b4*Stdtait4 + b5*Investmentit5 + b6*Inefficiencyit6 + b7*Marginit7 + b8*Crit8 + b9*ROAit9 + b10*ROEit10 + b11*Receivablesit11 +b12*RER it12 + b13*Caps it13 + b14*Age it1 + VI + eit where i = 1,2,...,n and t = 1,2,..,t (*)
In which: b0: Block Factor.
b1, b2, b3, b4, b5, b6, b7, b8, b9, b10, b11, b12, b13, b14: are the slope coefficients of independent variables.
mIt = micro + it e , the error of the model is separated into two parts: micro represents unobservable factors that vary from object to object but do not change over time, it e represents those unobservable factors that vary from object to object and change over time.
RESULTS
The study utilized Stata 14 software to analyze the data variables in the model. The results (table 3) include 591 observations over eight years from 2013 to 2020. The dependent variable is the Sustainable Growth Rate (SGR), which has a mean value of -0,492, a minimum value of -1 630 931, a maximum value of 0,894, and a standard deviation of 173 339. The independent variables are as follows: Size (Logarithm of total assets) has a minimum value of 9 982 487, a maximum value of 1 355 351, and a mean value of 0,707. Self-financing ratio (SFA, Equity/Total assets) has a minimum value of 0,007, a maximum value of 1 001 333, and a mean value of 0,749. Financial leverage ratio (Leverage, Total debt/Equity) has a minimum value of 9,39e-06, a maximum value of 1 337 492, and a mean value of 0,930. Return on assets (ROA) has a minimum value of -0,837, a maximum value of 0,512, and a mean value of 0,01. Return on equity (ROE) has a minimum value of -1 578 287, a maximum value of 0,520, and a mean value of 0,019. Inefficiency (Operating expenses/Revenue) has a minimum value of -3 422 974, a maximum value of 1 933 174, and a mean value of 0,658. Receivables (Receivables/Total assets) has a minimum value of 0, a maximum value of 0,871, and a mean value of 0,135. Investment ratio in short-term assets (Investment, Current assets/Total assets) has a minimum value of 0,117, a maximum value of 1, and a mean value of 0,879. Margin loan balance (Margin, Margin loan balance/Equity) has a minimum value of 0, a maximum value of 495 754, and a mean value of 0,283. Caps (Available capital/Total risk value) has a minimum value of -0,76, a maximum value of 495 754, and a mean value of 4 051 583. Retained earnings ratio (RER, Retained earnings/Total assets) has a minimum value of -1 610 339, a maximum value of 0,551, and a mean value of -0,386. Age (Logarithm of observation year - establishment year) has a minimum value of 0,60206, a maximum value of 1 322 219, and a mean value of 0,992. STDTA (Short-term debt/Total liabilities) has a minimum value of 0,60206, a maximum value of 1 322 219, and a mean value of 0,992. Current ratio (CR, Current assets/Short-term debt) has a minimum value of 1,001745, a maximum value of 106460,6, and a mean value of 231,2423.
|
Table 3. Statistical results of variables in the model |
|||||
|
Variable |
Note |
Mean |
Std. Dev. |
Min |
Max |
|
SGR |
591 |
-0,4929397 |
173 339 |
-1 630 931 |
0,8940278 |
|
Size |
591 |
1 157 993 |
0,7079798 |
9 982 487 |
1 355 351 |
|
SFA |
591 |
0,7493777 |
0,2393198 |
0,0074212 |
1 001 333 |
|
Leverage |
591 |
0,9305443 |
6 357 165 |
9,39E-06 |
1 337 492 |
|
TWO PEOPLE |
591 |
0,0109237 |
0,114262 |
-0,8378185 |
0,5126692 |
|
ROE |
591 |
0,0194436 |
0,1739335 |
-1 578 287 |
0,5206343 |
|
Inefficiency |
591 |
0,6588114 |
1 080 292 |
-3 422 974 |
1 933 174 |
|
Receivables |
591 |
0,135255 |
0,2088973 |
0 |
0,8716797 |
|
Investment |
591 |
0,8792737 |
0,1457196 |
0,1178448 |
1 |
|
Margin |
591 |
0,2834156 |
0,5683014 |
0 |
495 754 |
|
Caps |
591 |
4 051 583 |
3 442 888 |
-0,76 |
4 279 153 |
|
RER |
591 |
-0,3868091 |
1 361 325 |
-1 610 339 |
0,5516644 |
|
Age |
591 |
0,992536 |
0,1453892 |
0,60206 |
1 322 219 |
|
STDTA |
591 |
0,9406267 |
0,1724742 |
0,0117455 |
1 |
|
CR |
591 |
2 312 423 |
4 390 039 |
1,001745 |
106460,6 |
Standard deviation is used to measure the dispersion of the data set around the mean value, and it is easy to see the STD Deviation/Mean value of most variables with a value less than 1, the standard deviation is less than the average, the fluctuation data is weak, and the observed statistical data of the sample is low (figure 1).
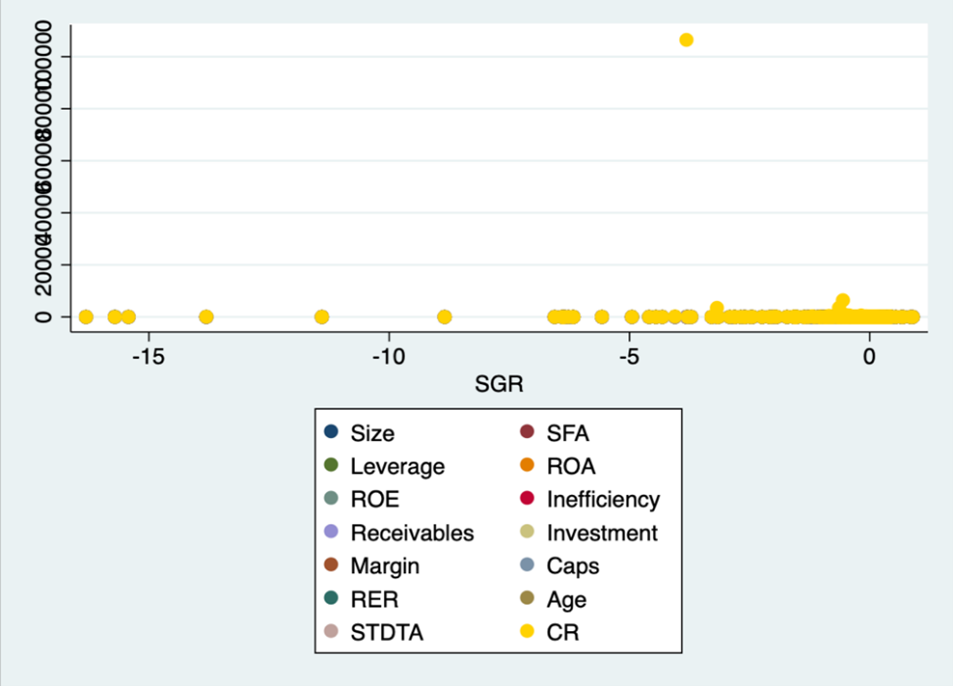
Figure 1. Sample data dispersion
The variables included in the model (*) are related torotation which have characteristics related to each other, so when running the regression, the author conducted a separate regression to avoid multilinearity. However, to consider whether the remaining independent variables are multilinear with each other, the authors conduct a multilinear test with independent variables when included in the model at the same time. Observing table 4, the VIF coefficients of the variables in the model are all less than 10. This shows that the study regression model has no multi-collinear phenomenon, independent variables do not affect the interpretation results of the model.
Next, the study conducts a multi-collinear test between variables in the model and tests the variable error variance (collin statement). The results of the multi-collilinear test shown in table 4 show that the independent variables have a value of VIF<10, proving that there is no multi-collinear.
|
Table 4. Results of multi-linear accreditation in FEM |
||||
|
Variable |
BRIGHT |
LIVE SQRT |
Tolerance |
R-Squared |
|
SGR |
9,23 |
3,04 |
0,1083 |
0,8917 |
|
Size |
2,90 |
1,70 |
0,3446 |
0,6554 |
|
SFA |
2,48 |
1,57 |
0,4037 |
0,5963 |
|
Leverage |
1,66 |
1,29 |
0,6040 |
0,3960 |
|
TWO PEOPLE |
7,79 |
2,79 |
0,1283 |
0,8717 |
|
ROE |
8,06 |
2,84 |
0,1241 |
0,8759 |
|
Inefficiency |
1,20 |
1,10 |
0,8301 |
0,1699 |
|
Receivables |
1,37 |
1,17 |
0,7301 |
0,2699 |
|
Investment |
1,20 |
1,10 |
0,8319 |
0,1681 |
|
Margin |
1,36 |
1,17 |
0,7360 |
0,2640 |
|
Caps |
1,44 |
1,20 |
0,6949 |
0,3051 |
|
RER |
8,80 |
2,97 |
0,1136 |
0,8864 |
|
Age |
1,63 |
1,28 |
0,6148 |
0,3852 |
|
STDTA |
1,14 |
1,07 |
0,8755 |
0,1245 |
|
CR |
1,03 |
1,02 |
0,9701 |
0,0299 |
|
Mean VIF |
3,42 |
|||
Thus, the FEM model does not have multi-collinear. In order to overcome the self-correlation defect and variable error variance, the study uses the Feasible Generalized Least Squares (FGLS) model to obtain a stable and effective estimate. The study used the esttab command to compare the models with each other (table 5). Command: esttab OLS FEM REM GLS, r2 star(*0,1**0,05*0,01) brackets nogap compress.
|
Table 5. Results of the remodeling of the NLTC model on the sustainable growth of Vietnam stock companies |
||||
|
. esttab OLS FEM REM GLS, r2 star(* 0,1 ** 0,05 *** 0,01) |
||||
|
Variables |
(1) |
(2) |
(3) |
(4) |
|
|
SGR |
SGR |
SGR |
|
|
Size |
0,158*** |
0,378*** |
0,220*** |
0,0383** |
|
|
[2,78] |
[3,02] |
[2,97] |
[2,11] |
|
SFA |
0,851*** |
0,690*** |
0,732*** |
0,340*** |
|
|
[5,59] |
[3,59] |
[4,41] |
[7,13] |
|
Leverage |
-0,0326*** |
-0,0389*** |
-0,0371*** |
-0,0113*** |
|
|
[-7,06] |
[-8,42] |
[-8,46] |
[-3,50] |
|
TWO PEOPLE |
-8,230*** |
-7,309*** |
-7,779*** |
-4,054*** |
|
|
[-17,56] |
[-14,59] |
[-16,96] |
[-12,41] |
|
ROE |
5,539*** |
4,632*** |
5,099*** |
2,992*** |
|
|
[17,77] |
[13,14] |
[16,47] |
[12,99] |
|
Ineffici~stock market |
0,0570** |
0,0695*** |
0,0673*** |
0,00809 |
|
|
[2,37] |
[3,03] |
[3,01] |
[0,84] |
|
Receivab~s |
-0,0955 |
-0,271* |
-0,198 |
-0,0325 |
|
|
[-0,72] |
[-1,89] |
[-1,51] |
[-0,89] |
|
Investment |
-0,190 |
-0,408* |
-0,316* |
-0,0281 |
|
|
[-1,06] |
[-1,82] |
[-1,66] |
[-0,58] |
|
Margin |
-0,0463 |
-0,0290 |
-0,0468 |
0,00708 |
|
|
[-0,95] |
[-0,34] |
[-0,74] |
[0,50] |
|
Caps |
0,0243*** |
0,0413*** |
0,0346*** |
0,00575* |
|
|
[2,96] |
[3,92] |
[3,77] |
[1,94] |
|
RER |
1,138*** |
0,980*** |
1,077*** |
1,075*** |
|
|
[54,39] |
[29,34] |
[41,67] |
[53,60] |
|
Age ` |
-0,382* |
-0,879*** |
-0,613*** |
-0,0577 |
|
|
[-1,84] |
[-3,19] |
[-2,65] |
[-0,99] |
|
STDTA |
-0,309** |
-0,253 |
-0,291* |
-0,0730* |
|
|
[-2,10] |
[-1,55] |
[-1,93] |
[-1,93] |
|
CR |
0,00000659 |
0,00000430 |
0,00000526 |
0,00000166 |
|
|
[1,20] |
[0,88] |
[1,07] |
[0,76] |
|
_cons |
-1,783** |
-3,676** |
-2,143** |
-0,597*** |
|
|
[-2,48] |
[-2,55] |
[-2,41] |
[-2,67] |
|
N |
591 |
591 |
591 |
591 |
|
R-sq |
0,892 |
|||
|
t statistics in brackets |
||||
|
* p<0,1, ** p<0,05, *** p<0,01 |
||||
Model regression results (table 5): SGR = 0,0383*Size + 0,340*SFA - 0,0113*Leverage - 0,0730*STDTA + 0,00575*Caps - 4,054*ROA + 2,992 *ROE + 1,075*RER + µ
The determination coefficient (R2) is the coefficient that evaluates the suitability of the regression model. The value of the coefficient (R2) indicates how much percentage of variation in the dependent variable can be explained by the regression model. Based on the regression results (table 5) for the results, including 8 independent variables that explain 89,2 % of the variation of SGR, including: Size of the stock (Size); Self-financing coefficient (SFA); Debt-to-equity ratio (Leverage); Profitability on size of equity (ROE); Profitability on total assets (ROA); Earnings Ratio (RER) and Available Capital Ratio (Caps). Specifically, the impact results are as follows:
· Size of securities: has the same impact on the sustainable growth (SGR) of securities, a high significance of 5 %. If the capital size of the securities is larger, the income of the securities will be strong with the impact when the size of the securities increases by 1 unit, the probability of the income of the securities will increase by 0,0383 units. The regression results coincide with the research results of the researchers: (29,11,21,22,1,4,24,2,12,28) and vice versa research results by(13,14,17,25). This is in line with the practice in Vietnam, when a securities company with a large capital scale will help them have good financial autonomy and at the same time have many opportunities to carry out business activities and also easily support when risks occur.
· Self-financing coefficient (SFA): has the same impact on the sustainable growth (SGR) of securities, with a high significance of 1 %. In the period, the higher the ability to self-finance, the stronger the NLC, the more sustainable the growth of the stock. The regression results coincide with the research results of the researchers:(3,1,4,22,26). This is in line with the reality in Vietnam when size of equity reflects the financial strength of a securities company, this capital source determines the scale of operation of the securities company, which is the basis for the securities company to conduct business operations, attract other capital sources and lend margin transactions. Therefore, with a high self-financing coefficient, the stronger the NLT, the more sustainable the growth.
· Debt-to-equity ratio (Leverage): has the opposite impact on the sustainable growth (SGR) of securities, with a high significance of 1 %. The greater the use of financial leverage of any securities company, the lower the financial performance of the securities will decrease with the impact that when the leverage increases by 1, the probability of the financial performance of the securities will decrease by 0,0113 units. Regression results coincide with research results:(37,36,32,28,8,19). In contrast, the research results of (27,23,2).
· Short-term debt ratio (STDTA): has the opposite impact on the sustainable growth (SGR) of securities, a meaningful level of 10 %. In the period of 2013-2020, Vietnamese securities companies tended to use short-term financing, on the one hand, they were exposed to the risk of high interest rates, on the other hand, and on the other hand, the efficiency of capital use was low, thereby reducing the profitability of securities companies, thereby adversely affecting sustainable growth.
· Return on equity (ROE): having the same impact on the sustainable growth (SGR) of the stock, a very high significance of 1 %. If the profitability on size of equity of securities is greater, the profitability of securities is stronger. The regression results coincide with the results of(25) study, in contrast to the study of (31,15,19,5,22,24,2,26,33,27). This is also in line with the practice in Vietnam, when a securities company with an increased rate of return on size of equity means that the securities company has an effective business and thus contributes to increasing size of equity through the profit left, so that financial strength will be further enhanced.
· Profitability on total assets (ROA): has the opposite impact on the sustainable growth (SGR) of the stock, a high significance of 1 %. During the research period, securities companies have not made good use of the assets of securities companies, and have not contributed to increasing the income of securities companies. The regression results coincide with the results of a study by(15). In contrast to the research results of (25,33,27,22,5,31,2,19,24,26,32).
· Return on equity (RER): there is an impact in the same direction on the sustainable growth (SGR) of the stock, the significance level is as high as 1 %, which shows that the more the stock company increases the rate of profit left for reinvestment, it will increase the sustainability of the stock. Increasing the rate of retained earnings is one of the ways to increase the net income of securities companies, so through this variable, it shows that net income has the same impact on sustainable growth. The regression results coincide with the research results of(32) and vice versa with the research results of (17,23).
· Ratio of available capital (Caps): having the same impact on the sustainable growth (SGR) of securities, a high significance of 10 %. Vietnamese securities companies have balanced profitability and financial safety, ensuring the usable capital adequacy ratio, which means that asset quality is improved, the level of risk is low, and the efficiency of capital use increases, thereby positively impacting the sustainable growth of securities. If the securities company has Caps, it leads to insolvency, leading to bankruptcy.
In addition, the model (*) shows a little meaningful relationship between the following variables: solvency (CR); Ratio of receivables (Receivables); Inefficiency; Margin loans with sustainable growth. The implication of managing activities such as improving payment capacity, maintaining low receivables, improving operational efficiency, and strengthening securities credit has not made a significant contribution to increasing financial resources as well as sustainable growth of securities companies. Especially in the research period, no meaningful relationship was found between the age variable (Age) of securities and sustainable growth, which means that the longer the operating time, the more experience in theory in management and administration, the advantage of market share, etc and profits help the stock company grow sustainably, but the result of the model retracement (*) gives the opposite result.
DISCUSSION
First, increasing the size of equity
Increasing the size of size of equity is considered the first and prerequisite solution stemming from the theory and practice in business activities of securities companies. First of all, securities managers need to be properly aware of the increase in size of equity for the following reasons:
· Firstly, securities companies must ensure financial principles and financial prudential indicators according to Circular 91/2020/TT-BTC dated November 13, 2020 (stipulating financial prudential norms and handling measures for securities trading organizations that do not meet financial prudential norms) and avoid risks in business activities.
· Second, meet international standards, including principle 22, the minimum capital level for market participation of the International Organization IOSCO Securities Commissions and the recommendations of the Basel Committee. From there, increasing the company’s credibility, the stock company can easily raise capital in the international financial market, as well as domestically.
· Third, strong capital capacity will help the stock company invest in marketing strategies and human resources, as well as information technology (fintech) systems to meet the desired needs and increase revenue from customers.
· Fourth, securities companies will be allowed to expand their business activities through commodity products with capital requirements such as Circular 121/2020/TT-BTC dated 31/12/2020 or derivative securities under Decree 158/2020/ND dated 31/12/2020.
Thus, the increase in size of equity will be the result of meeting the capital standards of the securities company. In addition to the initial size of equity capital, securities companies need to develop strategies as well as at all times have plans to raise capital in many different ways. Initially, size of equity will only meet the current management and investment activities, but the development of the market requires increasingly high capital, to carry out more and more profitable business operations.
In the system of Vietnamese securities companies, each company has different strong and weak capital capacity, the increase in size of equity must be in accordance with the conditions and business strategy of each company. The choice of capital increase plan must be based on criteria such as capital mobilization costs, dispersion of management rights, time, etc. or the feasibility of each capital increase option.
Plan to increase size of equity of securities in group 1
This is a group of securities with an advantage in size, accounting for up to 80 % of the brokerage market share, however, in order to expand the operating area and improve competitiveness, it is necessary to increase the capital of this group of securities, the current status of the solvency of securities in this group is not guaranteed. However, unlike small stocks, the increase in size of equity of group 1 stocks is not urgent and has many advantages. It is important for securities companies to choose the most optimal capital increase plan. Options that can be used by securities companies in group 1 include:
First, increase the rate of retained earnings, reduce dividends distributed to shareholders annually
With good business results, securities in group 1 will retain a part of the after-tax profit for reinvestment, not only increasing the securities company’s capital but also reducing the cost of using capital, because the securities company’s capital is fully entitled to use without being pressured on time and conditions for debt repayment or interest payment. however, the securities company must achieve a profit on size of equity greater than the bank interest rate. Thus, increasing size of equity from retained profits, the stock company both ensures the capital needs for business activities without admitting new members, must share control of the company and increase financial independence.
Secondly, increasing size of equity from issuing more shares from existing shareholders
In the process of operation, the stock company wants to increase size of equity but does not want to “dilute” the company’s control and benefits for new shareholders. The securities company issued more shares to increase size of equity from existing shareholders. When newly issued shares are distributed to existing shareholders according to the proportion of contributing shares, the interests of shareholders are not changed. However, both cases of dividends of 1 share are the same. The number of additional shares issued increases in the same direction as the profit earned, the dividend of 1 share remains unchanged.
Mobilizing to increase size of equity by issuing more shares from existing shareholders has the advantage of not increasing the number of shareholders, so they do not have to share the right to manage the securities as well as the benefits that the company brings, so it is easy to be supported by shareholders. To increase size of equity by issuing more existing funds, the most reasonable option is to pay dividends in shares.
Third, increase size of equity through the admission of new members
In business activities, when the required capital is not enough to cover the needs of operations, securities companies can admit new members, and focus on institutional members, financial potential, and strategic shareholders to increase size of equity by issuing new shares. However, when increasing size of equity by admitting new members, the stock company needs to consider the benefits brought between increasing profits when expanding the scale from the increased number of size of equity and sharing control of the company. Securities companies also need to consider between the amount of mobilized capital and the scale of operation, on that basis, allocate capital reasonably to minimize the cost of using capital to maximize profits and avoid capital waste.
Fourth, increase size of equity by issuing new shares
The securities company issues new shares for sale, the newly issued shares can be offered for sale or issued privately or offered to the public, which is applied to securities operating under the share model. This is a long-term capital mobilization activity, the stock company can issue ordinary shares and preferred shares.
Attracting capital from foreign investors
As large-scale securities with many sustainable growth prospects, group 1 stocks will have the opportunity to attract capital from foreign investors. According to Article 77 of the Law on Securities, foreign investors participating in contributing capital to the establishment and purchase of shares, contributed capital of a securities company are entitled to own up to 100 % of the charter capital of a securities company in case the investor is licensed and has a continuous operation time in the banking sector. securities and insurance within 02 consecutive years of participating in capital contribution, purchase of shares or contributed capital; The licensing authority of the country of origin and the SSC have signed bilateral or multilateral cooperation agreements on information exchange, cooperation in management, participation and supervision of securities and stock market activities; Profitable business activities in 02 consecutive years preceding the year of participation in capital contribution, purchase of shares, contributed capital and financial statements of the latest year must be audited. In case of ineligibility requirements, foreign investors who are organizations and related persons are only allowed to own up to 49 % of the charter capital of the securities company. However, among the large securities companies, only a few securities companies have found partners, such as SSI Securities as of December 31, 2020, the total share capital of foreign investors is 20 %, Ho Chi Minh City Securities (holding rate is 29,96 %), BSSI Securities (14,9 %). A large number of securities companies have not found suitable partners in terms of business views and strategies, with these securities companies, if they want to increase foreign capital, they must find new investors, which is relatively difficult. However, when the financial situation of securities is transparent and improving, this is a relatively feasible option for securities.
Acquisition or merger with other securities
The restructuring scheme under Decision No. 242/QD-TTg for the group of securities with healthy operations (financial prudential target of more than 180 %, size of equity of more than VND 1000 billion and no accumulated losses) is encouraged to participate in the handling of securities in the group of weak performance. Therefore, with healthy securities, this solution can create a bounce in expanding the market to occupy market share. And in the group of weak securities with potential securities with certain competitive advantages, group 1 securities can aim to merge with these securities in order to limit risks and at the same time the ability to implement solutions depends on the merger partner and negotiation agreement between securities.
Plan to increase size of equity of securities in group 2
Group 2 stocks are stocks with a lot of prospects and are very active in increasing capital. The plan to increase the capital of securities in this group is in order of priority: increasing retained profits, issuing shares to existing shareholders, attracting capital from foreign investors, through venture capital funds and merging with other securities.
Plan to increase size of equity of stocks in group 3
This is a group of securities that are required to increase the size of equity. Mergers and acquisitions, mergers and acquisitions and through venture capital funds or looking for foreign investors are feasible options for this group of securities companies.
Mergers and acquisitions, mergers and consolidations
Practice shows that after consolidation, securities will achieve higher capital capacity, brand value, infrastructure, competitiveness, technology, etc., mutual compensation in terms of assets can be considered as one of the reasons and benefits why companies decide to cooperate and consolidate with each other.
In essence, the consolidation and merger of securities companies is the fastest option to increase the capacity of capital, payment and profitability. A typical case is MBS Securities and VIT Securities consolidation in September 2013. After the consolidation, MBS’s business results in 2014 have achieved impressive business results with revenue increasing more than 15 times compared to 2013, profit after tax increasing by more than 160 %, while before that, both VIT and MBS Securities lost VND 34,6 billion and VND 534,8 billion, respectively. The success of the deal is a typical example of the direction of securities with VC of less than VND 250 billion, with weak net income.
Looking for foreign investors
size of equity securities smaller than VND 500 billion are required to be restructured to survive, while it is not easy to implement the merger and consolidation plan due to lack of compatibility with other securities partners, the plan to find foreign investors is a good choice. If this option is implemented, not only can the securities company increase the scale of capital, but also help the securities company improve its management and administration capacity, and at the same time allow the securities company to learn and be supported with experience in applying technology to management, as well as better meet the needs of services. especially investment banking services. However, with the current unfavorable financial situation, the opportunity to find foreign investors will be difficult, but it is not impossible, for example, PSI Securities has found an investor SMBC Nikko Securities (ownership rate of 14,9 %).
Through venture capital funds
This is a relatively new capital mobilization option in Vietnam, venture capital funds will provide capital to securities with development potential, new technology or feasible business models. Therefore, securities companies with certain advantages can choose the method of capital mobilization through these investment funds.
Secondly, develop a debt capital mobilization strategy suitable for securities
In fact, the selection of mobilized capital to establish a sound financial structure always encounters complex problems, requiring consideration of capital sources in an interpersonal relationship. Therefore, the issue of building a capital mobilization strategy both meets the capital needs for business and creates conditions to improve the efficiency of capital use for securities companies.
The debt capital mobilization strategy of the securities company must come from the capital structure associated with the operating objectives of the securities company, and at the same time be suitable to the current situation of the capital market and business environment in each period. The capital mobilization strategy of construction securities must be close to reality, because each department in the debt capital structure has a different turnover period, mobilization costs, and recovery time, requiring each securities company to come from the actual situation of using capital in its period, assess the conditions and trends of market supply and demand changes, thereby building a strategy mobilizing capital in line with growth needs.
Strengthen capital mobilization through bond issuance
On 30/11/2006, SSI Securities successfully carried out the first issuance of convertible bonds on the stock market, opening up an effective debt mobilization plan for public securities companies and listed companies. Normally, through the use of bonds, securities companies can make medium and long-term loans through the market with a large volume. Currently, this capital mobilization channel is usually only used by a number of securities in group 1. For securities companies, the offering and trading of individual corporate bonds in the domestic market and the offering of corporate bonds to the international market need to meet the conditions according to Decree 153/2020/ND-CP such as: meeting the financial prudential ratios and prudential ratios in operation; having an approved bond issuance plan; having an audited financial statement of the preceding year of the year of issuance... and meet the financial principles of the securities company.
To increase capital mobilization through banks and credit institutions
In the capital structure of securities companies, bank loans and credit institutions always account for a very large proportion, this is the traditional capital mobilization channel of securities companies. To raise the credit limit, securities companies need to strengthen relationships by building trust and keeping trust. Raising capital from cyclical debts requires the securities manager to firmly grasp the requirements for the payable term of each loan. On that basis, securities companies need to have a plan to allocate and use capital of debts effectively, and at the same time repay debts on time to increase the reputation of securities companies.
Raising capital through financial leasing
It is an irrevocable medium and long-term credit financing method. In this method, the tenant usually buys assets and equipment at the request of the tenant and holds the ownership of the leased property. The lessee shall use the leased property and pay the rent during the agreed term and shall not cancel the contract ahead of time. Upon the expiration of the lease term, the lessee may transfer ownership, acquire or continue to lease such property depending on the conditions agreed upon in the lease contract. This is a relatively new method of capital mobilization in Vietnam, but it is also considered an effective capital mobilization channel for securities companies that want to invest in more modern technology equipment.
Thirdly, to restructure capital sources in accordance with the business plan and development goals of the securities company
Each securities company can use one or more sources of capital to finance business activities, can use short-term or long-term capital, use liabilities or size of equity depending on the securities company itself and objective factors. Due to the specific nature of securities trading activities, accounting for a large proportion of the assets of securities securities are financial investments (short-term and long-term financial investments) and receivables accounting for a large proportion are securities loans to customers to invest in securities when using margin purchase services. This is the basis for securities restructuring appropriate capital sources.
Currently, the debt ratio of group 1 securities is at a very high level, with an average of over 47 %, but mainly short-term debt (over 90 %), which has a lot of potential risks. That leads to securities being dependent on loans, leading to an increasing cost of using loans. Meanwhile, stocks in group 2 and group 3 with relatively low debt coefficients can choose the option of increasing debt capital but prioritize long-term debt. In the coming time, these securities companies need to adjust their reasonable structure to improve the company’s solvency in the short term and sustainable growth in the long term. In order to build a reasonable capital structure for securities companies, it is necessary to make a decision to finance capital with liabilities or size of equity in a reasonable way so that the cost of using capital is at the lowest level, and at the same time limit the risks arising.
The long-term strategy of the capital structure of the securities company is to prioritize internal resources and limit external forces with a higher rate of financing by size of equity to avoid risks, create a financial flexibility mechanism and withstand economic shocks, because securities trading is greatly affected by business environment factors.
Thirdly, restructuring assets according to each main activity of the securities company
In order for the stock company to develop sustainably, the capital used for main business activities needs to be reasonably allocated, especially it is necessary to create a balance between 04 brokerage activities, proprietary trading, financial consulting, and guarantee consulting to be really reasonable and balanced. Thus, in the conditions of ups and downs of the stock market, the activities of the stock market are still maintained and developed well and deeply. Some solutions such as:
Restructuring the investment portfolio
Currently, securities companies participating in investment activities include: investing in unlisted stocks, investing in listed stocks and investing in bonds. Securities trading always adheres to the principle of “Do not put too many eggs in one basket”. Although each stock company has a preferred investment product, it does not mean that the securities companies focus on one product. On the basis of market analysis, securities companies need to be flexible in maintaining the structure in the investment portfolio. To do this, the stock market needs to analyze and forecast the trend accurately.
Rational allocation of capital for brokerage activities
Modernize material and technical foundations, develop business activities in association with the strategy of positioning and classifying customers (current and potential customers, individual and organizational customers, domestic and foreign customers), improve the quality of consulting human resources.
Spectrum of use of capital for consultancy and depository activities
Strengthen customer search and expansion, improve the quality of consulting activities, enhance the ability to analyze and forecast stock market trends, and innovate consulting activities.
Increase capital to participate in underwriting consultancy activities
Increase the level of legal capital eligible to participate in activities, strengthen the search and development of the number of new customers, invest in material foundations, machinery and equipment systems and information technology software in service of guarantee activities.
In addition to the stability and balance in the use of capital mentioned above, some securities companies with advantages in corresponding activities need to maintain and promote higher efficiency in the use of corresponding capital but not too concentrate all capital to ensure sustainable growth in business activities of securities companies in the condition of any favorable fluctuations or the opposite of the stock market.
Final Thoughts
On the basis of the comprehensive application of research methods, the topic “The current situation of financial performance of Vietnamese securities companies” has gone into depth to consider:
Firstly, an overview of the formation and development process of Vietnam’s stock exchange system, the characteristics of production and business activities, and the presentation of the securities company system. With data collected and synthesized from audited financial statements and highly reliable sources, the topic has an overview of the financial situation of Vietnamese securities companies.
Secondly, the author uses an econometric model to assess the impact of financial capacity on the sustainable growth of securities. With the aim of helping analysts see the role of NLTC on sustainable growth and at the same time have a multi-dimensional view of the financial capacity of the stock market so that there are better solutions to improve the current situation of financial capacity.
BIBLIOGRAPHIC REFERENCES
1. Tran Thi Xuan Anh. Strengthening risk management in business activities of securities joint stock companies in Vietnam Banking Academy; 2014.
2. Phan Thi Hang Nga. Financial capacity of Vietnam Commercial Bank: City Banking University. Ho Chi Minh; 2013.
3. Nguyen Thi Cam Thuy. Completing the analysis of the financial situation of Vietnamese securities companies: National Economics University; 2013.
4. Hoang Thi Bich Ha. Financial security of Vietnamese securities companies: Academy of Finance; 2018.
5. Zhe C, Jiahui, Z., & Guohua, W. Research on the Performance Evaluation System of Listed Companies In Financial Securities Inducstry. Science Journal of Business and Management. 2017;5(3):122-31.
6. Takai A. What Kind of Companies Are Withdrawing? The Case of theJapanese Online Securities Industry. Annals of Business Administrative Science. 2017;16(1):41-54.
7. Shirata CY, editor Financial ratios as predictors of bankruptcy in Japan: an empirical research. Proceedings of the second Asian Pacific interdisciplinary research in accounting conference; 1998: Citeseer.
8. Masood S. Determinants of retained earnings in profitable companies in India_ a comparative study of selected sectors. 2013.
9. Junaidi S, Sulastri S, Isnurhadi I, Adam M. Liquidity, asset quality, and efficiency to sustainable growth rate for banking at Indonesia Stock Exchange. Jurnal Keuangan dan Perbankan. 2019;23(2):308-19.
10. IOSCO. Methodologies for Determining Minimum Capital Standards for Internationally Active Securities Firms Which Permit the Use of Models Under Prescribed Conditions. 1998.
11. Hu JL, & Fang, C. Y. . Do market share and efficiency matter for each other? An application of the zero-sum gains data envelopment analysis. Journal of the Operational Research Society. 2010;61(4):647-57.
12. Healy PM, Palepu, K. G., & Ruback, R. S. . Does corporate performance improve after mergers? Journal of financial economics. 1992;31(2):135-75.
13. Fang CY, & Hu, J. L. A metafrontier study of securities broker and dealer efficiency under zero-sum gains. Investment management and financial innovations. 2009(6, Iss. 3):25-34.
14. Elyasiani E, Mansur, I., & Pagano, M. S. Convergence and risk-return linkages across financial service firms. Journal of Banking & Finance. 2007;31(4):1167-90.
15. Claessens S, & Schmukler, S. L. International financial integration through equity markets: Which firms from which countries go global? Journal of International Money and Finance. 2007;26(5):788-813.
16. Bollen KA. A new incremental fit index for general structural equation models. Sociological methods & research. 1989;17(3):303-16.
17. Asgari MR, Pour, A. A. S., Zadeh, R. A., & Pahlavan, S. . The relationship between firm’s growth opportunities and firm size on changes ratio in retained earnings of listed companies in Tehran Stock Exchange. International Journal of Innovation and Applied Studies. 2015;10(3):923.
18. Akhtar M, Yusheng K, Haris M, Ain QU, Javaid HM. Impact of financial leverage on sustainable growth, market performance, and profitability. Economic Change and Restructuring. 2022;55(2):737-74.
19. Wang T. Empirical research on financial capability evaluation of A-share listed companies in the securities industry based on principal component analysis2017. 21-6 p.
20. Thanatawee Y. Life-cycle theory and free cash flow hypothesis: Evidence from dividend policy in Thailand. International Journal of Financial Research. 2011;2(2).
21. Tas O, Cevikcan G. EFFICIENCY AND PRODUCTIVITY OF TURKISH SECURITIES FIRMS: 2011-2015. PressAcademia Procedia. 2017;3(1):75-80.
22. Samuels P. Advice on exploratory factor analysis. 2017.
23. Rubunda E, Namusonge GS, Oluoch O. The Influence of Retained Earnings and Equity Finance Structure on the Growth of Small and Medium Manufacturing Enterprises in Rwanda. European Journal of Social Sciences. 2019;58(2):112-23.
24. Pham Thi Van Anh. Solutions to improve the financial capacity of SMEs in Vietnam today: Academy of Finance; 2012.
25. Nugroho VC. Sustainable Growth Rate Model in Indonesia Manufacturing Firms. The Winners. 2020;21(2):93-100.
26. Nguyen Thi Tuyet. Solutions to improve the financial capacity of listed enterprises in the Vietnamese construction industry. 2020.
27. Mukherjee T, Sen SS. Sustainable growth rate and its determinants: A study on some selected companies in India. Global Multidisciplinary. 2018;10(1).
28. Mubeen M, Ahmed M, Iqbal A, Arif K. Sustainable Growth of Nonfinancial Firms: An Empirical Examination of Emerging Economies. Journal of Entrepreneurship, Management, and Innovation. 2021;3(2):331-54.
29. Lee D-G, Kim J, Kang H. Do larger brokerage firms enjoy larger economies of scale and scope? Seoul Journal of Economics. 2014;27:445-67.
30. King P, Tarbert H. Basel III: an overview. Banking & financial services policy report. 2011;30(5):1-18.
31. Huang X, Zhang J. Research on the financial sustainable growth of the listed companies on GEM. International Business and Management. 2015;10(2):32-7.
32. Higgins RC. How much growth can a firm afford? Financial management. 1977:7-16.
33. Hafid I. The effect of margin profit and total assets towards sustainable growth rate of the distributor and trade company. International Business Management. 2016;10(4):423-8.
34. Asgari MR, Pour AAS, Zadeh RA, Pahlavan S. The relationship between firm’s growth opportunities and firm size on changes ratio in retained earnings of listed companies in Tehran Stock Exchange. International Journal of Innovation and Applied Studies. 2015;10(3):923.
35. Amouzesh N, Moeinfar Z, Mousavi Z. Sustainable growth rate and firm performance: Evidence from Iran Stock Exchange. International Journal of Business and Social Science. 2011;2(23).
36. Alam S, Zahid MSI. Sustainable Growth Rate and Optimal Capital Structure. 2008.
37. Akhtar M, Yusheng K, Haris M, Ain QU, Javaid HM. Impact of financial leverage on sustainable growth, market performance, and profitability. Economic Change and Restructuring. 2021:1-38.
FINANCING
The authors did not receive financing for the development of this research.
CONFLICT OF INTEREST
The authors declare that there is no conflict of interest.
AUTHORSHIP CONTRIBUTION
Conceptualization: Tran Van Hai.
Data curation: Tran Van Hai.
Formal analysis: Tran Van Hai.
Acquisition of funds: Tran Van Hai.
Research: Tran Van Hai.
Methodology: Tran Van Hai.
Project management: Tran Van Hai.
Resources: Tran Van Hai.
Software: Tran Van Hai.
Supervision: Tran Van Hai.
Validation: Tran Van Hai.
Display: Tran Van Hai.
Drafting - original draft: Tran Van Hai.
Writing - proofreading and editing: Tran Van Hai, Le Thi Lan.