doi: 10.56294/sctconf2024.1243
ORIGINAL
Effect of perceived value on customer satisfaction on audit services of financial statements: Case study of auditing companies in Hanoi
Efecto del valor percibido en la satisfacción del cliente en los servicios de auditoría de estados financieros: estudio de caso de empresas de auditoría en Hanoi
Vu Thuy Ha1 ![]() *, Pham Huy Hung1
*, Pham Huy Hung1 ![]() *
*
1VNU University of Economics and Business, Vietnam National University, Hanoi, Vietnam.
2Hanoi University of Natural Resources and Environment, Vietnam.
Cite as: Ha VT, Hung PH. Effect of perceived value on customer satisfaction on audit services of financial statements: Case study of auditing companies in Hanoi. Salud, Ciencia y Tecnología - Serie de Conferencias. 2024; 3:.1243. https://doi.org/10.56294/sctconf2024.1243
Submitted: 29-03-2024 Revised: 06-07-2024 Accepted: 11-10-2024 Published: 12-10-2024
Editor: Dr.
William Castillo-González ![]()
Corresponding author: Pham Huy Hung *
ABSTRACT
This study investigates the impact of perceived value on customer satisfaction on the financial statement audit services of independent auditing firms in Hanoi. The study used quantitative research design, interpretation, and use of a survey questionnaire with a Likert-type scale to measure perceived value (including quality value, value based on price, human value, emotional value, and social value) and customer satisfaction. The survey was distributed to a random sample of 302 respondents, including CFOs; Accounting Managers; Business Owners; Audit Committee Members; and Internal Auditors of 168 selected client companies of different industries and sizes. Regression results with a standardized beta coefficient show that all five dimensions of perceived value have a positive impact on customer satisfaction, with Quality Value and Emotional Value having the strongest impact. Based on the research results, some recommendations are made for auditing companies such as prioritizing quality, improving emotional value, optimizing prices, building strong relationships with customers and leveraging social value to increase customer satisfaction. customer satisfaction on financial reporting audit services, so that auditing companies can improve competitive advantage and build long-term relationships with customers.
Keywords: Perceived Value; Audit of Financial Statements; Customer Satisfaction; Vietnam.
RESUMEN
Este estudio investiga el impacto del valor percibido en la satisfacción del cliente en los servicios de auditoría de estados financieros de firmas de auditoría independientes en Hanoi. El estudio utilizó el diseño de investigación cuantitativa, la interpretación y el uso de un cuestionario de encuesta con una escala de tipo Likert para medir el valor percibido (incluido el valor de calidad, el valor basado en el precio, el valor humano, el valor emocional y el valor social) y la satisfacción del cliente.La encuesta se distribuyó a una muestra aleatoria de 302 encuestados, incluidos directores financieros, gerentes de contabilidad, propietarios de negocios, miembros del comité de auditoría y auditores internos de 168 empresas clientes seleccionadas de diferentes industrias y tamaños. Los resultados de la regresión con un coeficiente beta estandarizado muestran que las cinco dimensiones del valor percibido tienen un impacto positivo en la satisfacción del cliente, siendo el valor de calidad y el valor emocional los que tienen el mayor impacto. Con base en los resultados de la investigación, se hacen algunas recomendaciones para auditar a las empresas, como priorizar la calidad, mejorar el valor emocional, optimizar los precios, construir relaciones sólidas con los clientes y aprovechar el valor social para aumentar la satisfacción del cliente en los servicios de auditoría de informes financieros, de modo que las empresas de auditoría puedan mejorar la ventaja competitiva y construir relaciones a largo plazo con los clientes.
Palabras clave: Valor Percibido; Auditoría de Estados Financieros; Satisfacción del Cliente; Vietnam.
INTRODUCTION
The audit services industry plays an important role in ensuring the accuracy and integrity of financial statements, facilitating sound decision making and enhancing corporate credibility.(1) In Vietnam, especially the capital Hanoi, the demand for audit services for financial statements is increasing due to the increasing number of enterprises, foreign investment and legal requirements.(2) With increasing competition among audit firms, understanding the factors that drive customer satisfaction is more important than ever.
Customer satisfaction is a fundamental concept in marketing and service management, defined as the customer’s assessment of a product or service as to whether it meets their needs and expectations.(3) In the context of audit services, customer satisfaction reflects the extent to which customers believe that the audit process and results have met their requirements, addressed their information needs, and supported their decision-making process.(4)
Satisfied customers are more likely to exhibit loyal behaviors, such as repeat purchases and positive word-of-mouth referrals, which contribute to the long-term success and profitability of service providers.(5) Moreover, enhancing customer satisfaction leads to competitive advantage, as satisfied customers are less likely to turn to alternative service providers.(6)
In the context of auditing, satisfied clients tend to adhere more to auditor recommendations, resulting in improved financial reporting quality and better audit results.(7) In addition, satisfied customers are more likely to use audit services long-term, leading to a stable source of revenue for audit firms.(8) In addition, customer satisfaction can generate positive referrals, enhance the auditor’s reputation, and attract new customers.(9) Furthermore, understanding the drivers of customer satisfaction is important, which can help audit firms narrow down the perceived value of their clients by better tailoring their offerings to meet customer expectations, leading to improved service quality and increased competitive differentiation.(4)
Perceived value is a multi-dimensional structure that reflects consumers’ overall assessment of the utility of a product or service based on their perception of what is received and what is spent.(10) In the context of audit services, perceived value represents the client’s assessment of the benefits received from the audit process versus the costs incurred (e.g., audit fees, time and effort).(11)
Perceived value has been widely recognized as an important premise of customer satisfaction in a variety of service contexts.(12, 13) Aspects of perceived value, such as: the functional, emotional, and social value of perceived value can all contribute to customer satisfaction with financial statement audit services. For example, when a client perceives an audit report to be accurate, reliable, and compliant with relevant accounting standards (functional values), they are more likely to be satisfied with the service. In addition, when clients feel that the audit process reduces their anxiety and uncertainty (emotional value), they tend to be more satisfied. Furthermore, when clients believe that partnering with a reputable audit firm will enhance their credibility in the business community (social value), they tend to be more satisfied with the service. Therefore, understanding the factors that drive customer satisfaction is more important than ever and this has attracted the attention of academics and professional activists.
Several studies have examined customer satisfaction across various service industries in Vietnam in recent years. A study in this area found that service quality has a substantial impact on customer satisfaction in retail banking. The research revealed that specific aspects of service quality, particularly responsiveness, assurance, and empathy, are key drivers of customer satisfaction.(14) Similarly, a study exploring the determinants of customer satisfaction in the e-commerce industry identified factors such as website quality, product variety, and delivery services as important drivers for customer satisfaction.(15) In the context of professional services, research examining the relationship between audit service quality and loyalty to audit firms in Vietnam demonstrated that service quality significantly affects customer satisfaction, which in turn affects customer loyalty.(16)
However, there is very little research focusing on the impact of perceived value on customer satisfaction on financial statement audit services in Vietnam. This research gap hinders understanding the inherent drivers of customer satisfaction in the audit services industry, especially in the context of Hanoi’s thriving business environment. Existing studies on customer satisfaction in the audit services industry mainly focus on developed economies, with little attention to emerging markets such as Vietnam.(4, 7, 11) In addition, while previous studies have explored the relationship between perceived value and customer satisfaction in a variety of service contexts, audit industry-specific characteristics suggest a more detailed and specific investigation is needed.(11,17) Furthermore, the multidimensional nature of perceived value requires comprehensive consideration of its various components (i.e. functional value, emotional value and social value) and their respective impact on customer satisfaction for financial statement audit services.
Therefore, this study was carried out focusing on the impact of perceived value on customer satisfaction on auditing services of financial statements of auditing firms in Hanoi city, in order to provide empirical evidence and practical insights for service providers to enhance their competitive advantage.
Theoretical Basis and Literature Review
Perceived value
Perceived value is a key concept in marketing and consumer behavior, reflecting customers’ overall assessment of the utility of a product or service based on their perception of what is received and what is spent.(10) In other words, perceived value expresses customers’ appreciation of the benefits and costs associated with a product or service, leading to a subjective trade-off between the two.(18)
Perceived value is a multi-dimensional construct that encompasses various aspects of a product or service’s utility. These dimensions include functional value (derived from functional, utility, or physical attributes), emotional value (generated from emotional or sensory states), social value (associated with specific social groups), cognitive value (related to novelty, curiosity, or knowledge), and conditional value (arising from specific circumstances or situations surrounding the product or service’s use). Each of these dimensions contributes to the overall perceived utility of a product or service.(19) Building on this concept, perceived value can be further conceptualized as a higher-order structure that includes multiple dimensions, such as quality, emotional response, reputation, and price. It represents the consumer’s assessment of the overall value or utility of a product or service, considering both the benefits and associated costs.(20)
These definitions show the multifaceted nature of perceived value, emphasizing the importance of trade-offs between benefits and costs, as well as the different dimensions that contribute to the overall perception of value.
In the audit services industry, customers who perceive high value from the audit process are more likely to be satisfied with the service, as their expectations and needs are met or even exceeded.(15)
Aspects of perceived value include
Functional value: Functional value refers to perceived utility derived from the functional, utility, or physical attributes of a product or service.(19) In the context of the audit of financial statements, functional value may be related to the accuracy, reliability and comprehensiveness of the audit report, as well as the technical and professional competence of the auditor.(21)
Emotional value: Emotional value relates to emotional states or feelings generated by a product or service, such as enjoyment, excitement, or reduced anxiety.(19) In the context of audit services, emotional value can be derived from the peace of mind, assurance, and uncertainty customers experience due to a thorough and reliable audit process.
Social value: Social value related to perceived utility derived from the association of a product or service with one or more specific social groups.(19) In the case of financial statement audit services, social value may arise from the enhanced credibility, reputation, and credibility that clients gain in the business community by partnering with a reputable audit firm.(22)
Other aspects of perceived value identified in the literature include perceived value (perceived utility derived from novelty, curiosity, or knowledge associated with a product or service) and conditional value (perceived utility derived from specific circumstances or situations surrounding the use of a product or service).(19)
Customer Satisfaction
Customer satisfaction is the assessment that a feature of a product or service, or the product or service itself, provides a satisfactory level of consumer-related satisfaction, including a level of satisfaction that is excessive or below expectations.(23) Accordingly, Oliver emphasizes the subjective nature of customer satisfaction, emphasizing that it is a judgment based on meeting expectations. The inclusion of under- or over-responsiveness indicates that satisfaction may vary based on the extent to which the product or service meets or exceeds expectations.
Building on this concept, customer satisfaction can be understood as the extent to which a product or service meets or exceeds customer expectations. This perspective focuses on the comparison between product or service performance and customer expectations, emphasizing the importance of meeting or exceeding these expectations as a key determinant of satisfaction.(3)
Furthermore, customer satisfaction can be viewed as the general evaluation of customers about the performance of the product or service compared to their expectations. This definition emphasizes the overall review process that customers go through when assessing satisfaction, highlighting the importance of customer expectations as a reference point for evaluating product or service performance.(24)
As can be seen, customer satisfaction is a satisfied customer response. It is the judgment that a feature of a product or service, or the product or service itself, has provided (or is providing) a level of satisfaction associated with pleasant consumption, including under- or over- satisfaction.(25) This definition by Anderson et al. combines elements from Oliver’s definition and Fornell’s definition. This definition emphasizes the satisfaction response and the evaluation process involved in evaluating satisfaction. The inclusion of under- or over-fulfillment indicates a change in satisfaction based on the level of satisfaction expected.
The above definitions together illustrate the multifaceted nature of customer satisfaction, emphasizing the importance of expectations, judgment, and fulfillment in shaping a customer’s overall evaluation of a product or service.
As such, customer satisfaction in the context of a financial statement audit service refers to a customer’s overall positive assessment of the audit process and results, based on how well they meet or exceed their expectations for accuracy, reliability, timeliness, compliance, and professionalism. This assessment includes the perceived functional, emotional and social value derived from the audit, as well as the quality of the relationship between the client and the auditor and the impact of the audit on the financial statements and communication with the client’s stakeholders.
Relationship between perceived value and customer satisfaction
Perceived value is widely recognized as an important premise of customer satisfaction, influencing post-consumer evaluation of the customer’s product or service.(12,13,26) The underlying mechanism connecting perceived value and customer satisfaction can be explained through the expectancy-confirmation model and equity theory.
Expectation-confirmation model: The expectation-confirmation model states that customers form expectations about a product or service before consumption and compares these expectations with perceived performance during or after consumption.(23) When perceived performance exceeds expectations, customers experience positive validation, which leads to satisfaction. Conversely, when perceived performance falls short of expectations, customers experience negative validation, resulting in dissatisfaction.
Perceived values play an important role in shaping customer expectations and influencing their perception of product or service performance. A high perceived value indicates that the benefits received from the product or service outweigh the costs, such as price, time, and effort. When customers perceive high value, they are more likely to have positive expectations and evaluate the performance of the product or service positively, leading to satisfaction.(10)
Equity theory: The theory of equity holds that customers judge the fairness of an exchange based on the ratio of their inputs (e.g., price, time, and effort) to outputs (e.g., benefits received from a product or service) to a reference object, such as competitors’ products or past experience.(27) When customers perceive the conversation as fair or beneficial, they are more likely to be satisfied.
Perceived value is closely related to fair assessment, as it represents the customer’s assessment of the benefits received relative to the costs spent. A high perceived value indicates a favorable input/output ratio, leading to a sense of equity and therefore satisfaction.(28)
Numerous empirical studies have demonstrated a positive relationship between perceived value and customer satisfaction in a variety of service contexts. For example, Cronin et al.(12) found that perceived value has a positive effect on customer satisfaction in service contexts, where service quality acts as an intermediary. Fornell et al.(13) have shown that perceived value is a strong predictor of customer satisfaction in the American Customer Satisfaction Index (ACSI) model. McDougall & Levesque(26) identified perceived value as the primary determinant of customer satisfaction in the context of professional services, where functional, emotional, and relational value dimensions have a significant impact on satisfaction. In the context of financial statement audit services, Chen et al.(11) found perceived value to positively influence customer satisfaction, with audit quality acting as a partial intermediary. Their findings highlight the importance of perceived value in shaping customer satisfaction with audit services.
Model of the influence of perceived value on customer satisfaction
Several research models have been proposed to examine the impact of perceived value on customer satisfaction. These models often combine many aspects of perceived value and explore their relationship to customer satisfaction.
The model proposed by Cronin et al.(12) considers the impact of perceived value on customer satisfaction in a service environment. The model includes aspects of perceived value such as quality, currency price, and non-monetary price. The authors argue that perceived value mediates the relationship between service quality and customer satisfaction. Their findings indicate that service quality is the main premise of perceived value, which in turn significantly affects customer satisfaction. This model emphasizes the importance of both the tangible and intangible aspects of service quality in shaping perceived value and customer satisfaction.
Sweeney & Soutar(20) developed a value conceptualization model that is perceived as a higher-order structure that includes many aspects: quality, emotional response, reputation, and price. The authors argue that these dimensions directly affect customer satisfaction. The study’s findings demonstrate that quality and emotional reactivity have a particular influence on determining customer satisfaction. This model highlights the multi-faceted nature of perceived value and the importance of both the functional and emotional aspects in shaping customer satisfaction.
The ACSI model of Fornell et al.(13) focuses on the impact of perceived value on customer satisfaction and loyalty. The model includes dimensions of perceived value such as perceived quality and perceived price. The authors argue that perceived value is an important premise of customer satisfaction, which in turn affects customer loyalty. The findings of the ACSI model emphasize the importance of perceived value in driving customer satisfaction and loyalty, making it an important factor for businesses looking to retain customers and build long-term relationships.
McDougall & Levesque(26) developed a model that examines the relationship between perceived value and customer satisfaction in the context of professional services. The model includes dimensions of perceived value such as functional value, emotional value, and relational value. The authors argue that these dimensions directly affect customer satisfaction. Their findings indicate that functional value, emotional value, and relational value significantly impact customer satisfaction. This model emphasizes the importance of both the tangible and intangible aspects of service value in shaping customer satisfaction.
Besides, Chen et al.(11) proposed to study the impact of perceived value on customer satisfaction for financial statement audit services. The model includes dimensions of perceived value such as functional value, emotional value, and social value. The authors argue that perceived value influences customer satisfaction, with audit quality acting as an intermediary. Their findings demonstrate that perceived value significantly influences customer satisfaction for audit services, with functional value being a particularly strong predictor. This model emphasizes the importance of perceived value in enhancing customer satisfaction and improving the quality of audit services.
In addition, Bolton & Lemon(28) conducted a study to examine the relationship between perceived value and customer satisfaction. The model includes dimensions of perceived value such as functional value, emotional value, and social value. The authors argue that perceived value is the primary determinant of customer satisfaction, with equity theory and the expectancy-aggressive model being the underlying mechanisms. Their findings indicate that perceived value significantly affects customer satisfaction, with fair assessment playing an important role. This model emphasizes the importance of fairness and meeting expectations in shaping customer satisfaction.
The above mentioned studies together illustrate the multi-dimensional nature of perceived value and its significant impact on customer satisfaction. They emphasize the importance of various aspects of service value, including functional, emotional, social, and relational dimensions, in shaping customer satisfaction. Understanding these relationships is essential for service providers to enhance their services, improve customer satisfaction, and build long-term relationships.
METHOD
Research models and hypotheses
Based on the theoretical basis and the above analysis, the theoretical model is proposed as follows:
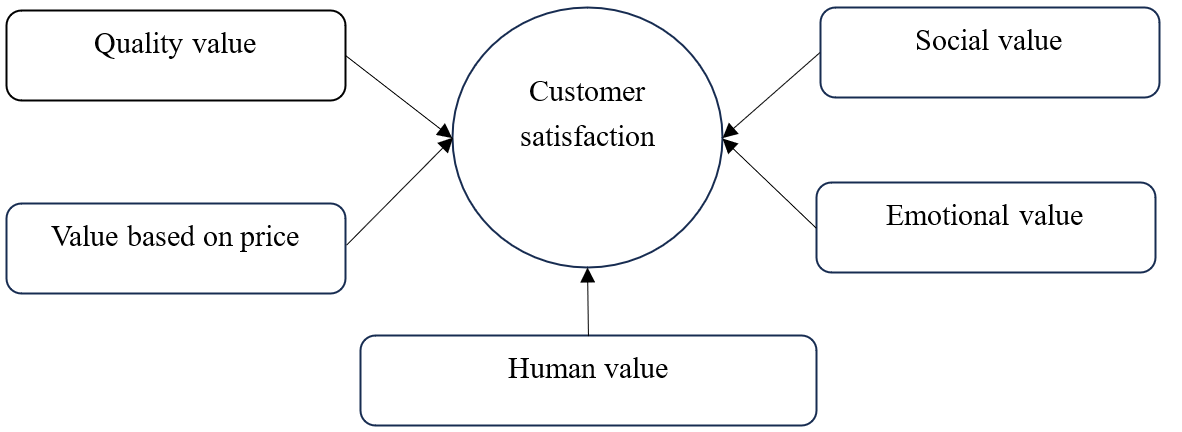
Figure 1. Research model on the influence of perceived value on customer satisfaction
With the multiple regression model as follows:
CUSA = β0 + β1*QUV + β2*VBP + β3*HUV + β4*EMV + β5*SOV + ε
Where:
β1, β2… is the regression coefficient, β0 is the intercept coefficient, ε is the residual
Dependent variable:
Customer satisfaction (CUSA)
Independent variables:
Quality value (QUV)
Value based on price (VBP)
Human value (HUV)
Emotional value (EMV)
Social value (SOV)
Restated hypotheses:
H1: Quality value has a positive effect on customer satisfaction auditing financial statements.
H2: The value calculated according to price has a positive effect on the satisfaction of customers auditing the financial statements.
H3: The value of personnel has a positive effect on the satisfaction of customers auditing the financial statements.
H4: Emotional value has a positive effect on the satisfaction of audit clients of financial statements.
H5: Social value has a positive effect on the satisfaction of audit clients of financial statements.
Data collection and processing
The author collects data through the use of questionnaires to collect opinions on the influence of perceived value on customer satisfaction when using auditing financial statements of independent auditing companies in Hanoi. The following subjects were selected to submit the survey questionnaire: Cheif Financial Officer, Accounting Management, Entrepreneur, Participants of the Audit Committee, Internal auditor.
Selected entities are directly involved in the financial reporting and auditing process. They have direct experience with audit services and can provide accurate and detailed information about their audit process, results, and satisfaction levels. In addition, these individuals hold decision-making authority within their organizations and have a strategic view of the audit process. Their opinions and reviews are important for understanding the broader implications of perceived value and customer satisfaction. In addition, the selected entities represent a core group of stakeholders involved in the audit process. Their diverse perspectives and experiences will ensure the representativeness and generalizability of the research findings.
Clients are selected based on the list of audit clients of listed audit firms whose annual reports are publicly available on the website https://finance.vietstock.vn. A total of 168 selected client companies of different industries and sizes.
To assess the level of satisfaction of audit clients (dependent variables), the author uses a 5-level Likert scale of agreement, from: (1) Strongly disagree to (5) Strongly agree. Evaluating independent variable factors, the author uses the Likert scale of 5 levels of influence, from: (1). Very low to (5). Very high. The number of scales measuring the variables is summarized in Appendix 1.
In addition, to ensure the study sample size, based on the minimum sample size requirement for EFA analysis and regression. According to Bollen(29), the sample size is calculated according to the formula n = 5*i (i is the number of observed variables in the model), corresponding to this study, the sample size will be 29 * 5 = 145. According to Tabachnick & Fidell(30), the sample size in the multiple linear regression analysis is calculated according to the formula n = 50 + 8q (q is the number of independent variables in the model), whereby the sample size of the study will be 50 + 8*5 = 90. In order to improve the reliability of the survey information, the study selects the largest sampling for the model according to one of the above principles.
The author uses a convenient sampling method and 302 valid votes are obtained out of a total of 500 submitted through the direct distribution of questionnaires, sending and receiving questionnaires through the Google form tool to the above survey subjects. Implementation duration: from March 2024 to July 2024. Based on the collected data, the author uses quantitative techniques such as reliability testing of the scale, exploratory factor analysis... with the use of IBM SPSS Statistics 22 to summarize and present the basic results of the study.
RESULTS AND DISCUSSION
Descriptive Statistical Analysis
The majority of respondents were men, accounting for 62,58 % of respondents. Females accounted for 37,42 % of respondents. This gender distribution reflects the demographic composition of the respondents who are predominantly male managers.
The majority of respondents were between the ages of 26 and 35, accounting for 42,05 % of the subjects. This age group represents a significant portion of the workforce engaged in the audit of financial statements. The second largest group is between 36 and 45 years old, accounting for 28,48 %. The younger age group (18 to 25 years old) and the older age group (over 55 years old) are the smallest, suggesting the sector may have a more experienced workforce.
The majority of respondents have a Bachelor’s degree, accounting for 52,32 % of respondents. This is followed by those with a Master’s degree (31,79 %) and a smaller proportion with a PhD (15,89 %). Education indicates a highly educated group of professionals, with a substantial body holding advanced degrees.
The job positions of respondents were diverse, with Chief Accountants being the largest group (30,46 %), followed by Business Owners (27,81 %) and Chief Financial Officers (17,88 %). Auditors and Internal Auditors make up a smaller percentage. This allocation suggests that the survey captures many of the key stakeholders involved in the audit of the financial statements.
The majority of respondents have between 6 and 10 years of experience (34,43 %), followed by those with between 11 and 15 years of experience (31,13 %). A significant portion also has more than 16 years of experience (25,17 %). The smallest group had 1 to 5 years of experience (9,27 %). This shows that the group of respondents has a lot of experience, adding credibility to the survey’s findings.
The respondents were from a variety of business lines, with commercial activities being the most represented (24,50 %), followed by Finance (19,21 %) and Technology (19,87 %). The manufacturing and healthcare industries are also significantly underrepresented. The “Other” category is the smallest, indicating that the survey has captured a wide range of industries.
|
Table 1. Characteristics of survey subjects |
||||
|
No. |
Demographic Information |
Person |
Percentage(%) |
|
|
1 |
Gender |
Male |
189 |
62,58 |
|
Female |
113 |
37,42 |
||
|
2 |
Age |
18 to 25 year |
16 |
5,30 |
|
26 to 35 year |
127 |
42,05 |
||
|
36 to 45 year |
86 |
28,48 |
||
|
46 to 55 year |
40 |
13,25 |
||
|
Over 55 years old |
33 |
10,92 |
||
|
3 |
Educational attainment |
PhD |
48 |
15,89 |
|
Master |
96 |
31,79 |
||
|
Bachelor |
158 |
52,32 |
||
|
4 |
Job position |
Cheif Financial Officer |
54 |
17,88 |
|
Chief accountant |
92 |
30,46 |
||
|
Business owner |
84 |
27,81 |
||
|
Participants of the Audit Committee |
40 |
13,25 |
||
|
Internal auditor |
32 |
10,60 |
||
|
5 |
Experiences |
Of between over one year and five years |
28 |
9,27 |
|
From 6 to 10 years |
104 |
34,43 |
||
|
From 11 to 15 years |
94 |
31,13 |
||
|
Over 16 years |
76 |
25,17 |
||
|
6 |
Business lines |
Manufacturing Industry |
56 |
18,54 |
|
Trading activities |
74 |
24,50 |
||
|
Finance |
58 |
19,21 |
||
|
Health care |
47 |
15,56 |
||
|
Technology |
60 |
19,87 |
||
|
Other |
7 |
2,32 |
||
Assess the reliability of the scale
The results of Cronbach’s Alpha test show that: independent variables Quality value, Value based on price, Human value, Emotional value, Social value, are measured by 24 observed variables. The reliability analysis results of the scale all have a Cronbach’s Alpha coefficient greater than 0,6. At the same time, the observed variables are correlated with total variables > 0,3 and Cronbach’s Alpha coefficient if the type of variables of the observed variables is less than Cronbach’s Alpha. Except for the observed variable EMV2 with a total variable correlation coefficient of less than 0,3, the author of this type of observed variable. Thus, the remaining independent variables and dependent variables meet the reliability. The results of the second scale test affect the perceived value on the satisfaction of audit customers on the audit service of financial statements in Hanoi city with 28 observation variables, as shown in table 2 below:
|
Table 2. The results of testing the reliability of the scale of factors in the model |
|||
|
No. |
Factor |
Cronbach’s Alpha |
N |
|
1 |
Quality value |
0,814 |
5 |
|
2 |
Value based on price |
0,805 |
5 |
|
3 |
Human value |
0,791 |
4 |
|
4 |
Emotional value |
0,762 |
4 |
|
5 |
Social value |
0,778 |
5 |
|
6 |
Customer satisfaction |
0,811 |
5 |
Thus, the model retains the same 6 factors to ensure good quality, with 28 variables characteristic of Cronbach’s Alpha coefficient of the overall is greater than 0,6; Variable correlation coefficient - the sum of the observed variables is greater than 0,3.
Exploratory factor analysis
The EFA exploratory factor analysis was performed separately for 02 groups of independent and dependent variables, the results are as shown in table 3.
|
Table 3. KMO and Bartlett test results for independent variables |
||
|
KMO and Bartlett’s Test |
|
|
|
Kaiser-Meyer-Olkin Measure of Sampling Adequacy |
0,748 |
|
|
Bartlett’s Test of Sphericity |
Approx. Chi-Square |
810,468 |
|
df |
416 |
|
|
Sig. |
0,000 |
|
The EFA analysis results for the independent variable in table 3 show that the KMO value is 0,748 and the Barlett test has a value of 810,468 with a significance level of Sig. = 0,000 < 0,05 proves that the data used in the analysis is suitable. There are 5 factors extracted at Eigenvalues = 1,168 > 1, so it can be confirmed that the number of factors extracted is appropriate. The total explanatory variance of factor analysis is 62,226 % > 50 %. This means 78,822 % change of factors is explained by variables. Next, the factor matrix table after rotation will be considered, the analysis results show that the observed variables have been gathered into 05 groups of variables with the order of the observed variables being kept the same compared to the original independent variables, the factor load factors are greater than 0,5, so these 05 groups of independent variables are of practical significance.
The results of the EFA analysis for the dependent variable show that the KMO coefficient = 0,756, so the exploratory factor analysis is appropriate for the actual data. Sig quantity. Satisfy the condition ≤ 0,05 should be statistically significant and the observed variables are correlated with each other in the whole, proving that the data used in the analysis is appropriate. Analysis of the total variance extracted for the dependent variable shows that the percentage value of the entire variance Percentage of variance = 63,248 % > 50 %, the Eigenvalue = 1,806> 1, so the model is eligible for exploratory factor analysis and the load factor of the observed variables is greater than 0,5, so the observed variables are of practical significance. So the dependent variable is kept the same as the original independent variable and there are 05 observed variables.
Logistic Regression Analysis
Pearson Correlation Analysis
This step is performed before the regression analysis to check the correlation between the independent variable and the dependent variable.
|
Table 4. Results of Pearson Correlation Analysis |
|||||||
|
|
QUV |
VBP |
HUV |
EMV |
SOV |
CUSA |
|
|
QUV |
Pearson Correlation |
1 |
|
|
|
|
|
|
Sig. (2-tailed) |
|
|
|
|
|
|
|
|
VBP |
Pearson Correlation |
,580** |
1 |
|
|
|
|
|
Sig. (2-tailed) |
,000 |
|
|
|
|
|
|
|
HUV |
Pearson Correlation |
,471** |
,420** |
1 |
|
|
|
|
Sig. (2-tailed) |
,0001 |
,000 |
|
|
|
|
|
|
EMV |
Pearson Correlation |
,392** |
,317** |
,301** |
1 |
|
|
|
Sig. (2-tailed) |
,000 |
,003 |
,000 |
|
|
|
|
|
SOV |
Pearson Correlation |
,320** |
,284** |
,253** |
,228* |
1 |
|
|
Sig. (2-tailed) |
,0013 |
,000 |
,002 |
,000 |
|
|
|
|
CUSA |
Pearson Correlation |
,650** |
,525** |
,462** |
,472** |
,432** |
1 |
|
Sig. (2-tailed) |
,000 |
,001 |
,000 |
,002 |
,000 |
|
|
|
**. Correlation is significant at the 0,01 level (2-tailed) *. Correlation is significant at the 0,05 level (2-tailed) |
|||||||
QUV (Quality Value): The Pearson correlation values OF QUV with other factors (VBP, HUV, EMV, SOV, CUSA) are all positive and significant at 0,01, indicating a strong positive relationship.
VBP (Price Based Value): Pearson correlation value for VBP with other factors is also positive and significant at 0,01.
HUV (Human Values): The Pearson correlation value of HUV with other factors is positive and significant at 0,01.
EMV (Emotional Value): Pearson’s correlation value for EMV with other factors was positive and significant at 0,01, except that SOV was significant at 0,05.
SOV (Social Value): Pearson correlation value for SOV with other factors was positive and significant at 0,01, except EMV was significant at 0,05.
CUSA (Customer Satisfaction): CUSA’s Pearson correlation values with other factors are both positive and significant at 0,01, indicating a close positive relationship.
Regression analysis
Based on the results of the EFA analysis, we have the multiple regression model as follows:
|
Table 5. Model summary tableb |
||||
|
Model |
R |
R Square |
Adjusted R Square |
Durbin-Watson |
|
1 |
,872a |
,731 |
,601 |
1,378 |
|
a. Predictors: (Constant), QUV, VBP, HUV, EMV, SOV. b. Dependent Variable: CUSA. |
||||
R2 correction = 0,601 > 0,5 proves the suitability of the model is acceptable. This means that independent variables explain 60,10 % of the change of the dependent variable “Customer satisfaction of auditing services of financial statements in Hanoi city”, while 39,9 % is due to random errors or other factors outside the model.
Test the relevance of the model
The assessment of the relevance of the model is based on the Analysis of Variance (ANOVA). ANOVA test results with Sig significance level. = 0,000 shows that the constructed multiple linear regression model is consistent with the dataset.
|
Table 6. Results of linear regression Coefficientsa |
||||||||
|
Model |
Unstandardized Coefficients |
Standardized Coefficients |
t |
Sig. |
Collinearity Statistics |
|||
|
B |
Std. Error |
Beta |
Tolerance |
VIF |
||||
|
1 |
|
0,568 |
0,153 |
|
3,724 |
0,000 |
|
|
|
QUV |
0,261 |
0,035 |
0,386 |
7,754 |
0,000 |
0,810 |
1,234 |
|
|
VBP |
0,155 |
0,031 |
0,243 |
5,105 |
0,000 |
0,864 |
1,157 |
|
|
HUV |
0,105 |
0,032 |
0,163 |
3,465 |
0,001 |
0,850 |
1,176 |
|
|
EMV |
0,187 |
0,029 |
0,301 |
6,750 |
0,000 |
0,991 |
1,009 |
|
|
SOV |
0,123 |
0,032 |
0,178 |
3,957 |
0,000 |
0,937 |
1,067 |
|
|
a. Dependent Variable: CUSA. |
||||||||
Based on the above results, we see:
Testing of multicollinearity: The variance magnification factor (VIF) of all independent variables is less than 5, so multicollinearity in the model is assessed as not serious.
The Durbin-Watson coefficient used to test the correlation of the residues shows that the model does not violate when using the multiple regression method, because the Durbin-Watson value is 1,378. In other words, the model has no correlation of residues.
The independent variables QUV, VBP, HUV, EMV, SOV are statistically significant (due to Sig.< 0,05) to the CUSA dependent variable and the coefficient β > 0 proves to have a positive effect on the CUSA dependent variable. Therefore, accepting the initial hypothesis, the independent variables are linearly related to the dependent variable and are fully consistent with the model. The standardized recursive equation is as follows:
CUSA = 0,386*QUV + 0,243*VBP + 0,163*HUV + 0,301*EMV + 0,178*SOV
The regression results with the standardized beta coefficient show that all 5 factors QUV, VBP, HUV, EMV and SOV have a positive effect on the satisfaction of auditing customers on the financial statement audit services of independent auditing companies in Hanoi.
QUV (Quality Value): The quality value has the highest standardized beta coefficient (0,386), indicating that it has the strongest positive impact on customer satisfaction. This shows that the client values the accuracy, reliability and technical competence of the audit services. Audit firms should prioritize providing high quality audit services to enhance customer satisfaction.
VBP (Price-Based Value): The price-based value has a standardized beta coefficient of (0,243), which shows a significant positive impact on customer satisfaction. This means that the client considers the cost of the audit service against the benefit they receive. Audit firms must ensure their prices are competitive and that customers feel the value for money is worth it.
HUV (Human Value): The human value has a standardized beta coefficient of (0,163), indicating a positive impact on customer satisfaction. This shows that the professionalism, responsiveness, and reliability of auditors contribute to customer satisfaction. Audit firms should focus on building strong relationships with clients through courteous, professional and responsible service.
EMV (Emotional Value): Emotional value has a high standardized beta coefficient (0,301), indicating a strong positive impact on customer satisfaction. This means that the client values the peace of mind, peace of mind, and reduced anxiety brought about by the audit process. Audit firms should strive to provide a comfortable and reassuring audit experience to enhance customer satisfaction.
SOV (Social Value): Social value has a standardized beta coefficient of (0,178), indicating a positive impact on customer satisfaction. This shows that customers value enhancing their company’s reputation, credibility and image in the business community through the audit process. Audit firms should emphasize the reputational benefits and social value of their services to their clients.
The results of the study show the multi-dimensional nature of customer satisfaction with financial statement audit services. Quality Values, Price Based Values, People Values, Emotional Values and Social Values all contribute positively to customer satisfaction.
The results of this study are similar to some previous studies, in terms of the importance of Quality Value, this study found that Quality Value (QUV) has the highest standardized beta coefficient (0,386), showing a strong positive impact on customer satisfaction. Previous studies, such as (4), found that the accuracy and reliability of audit reports significantly affect customer satisfaction, and Chen et al.(11), emphasizing the importance of audit quality in enhancing customer satisfaction, also emphasizing the important role of quality in determining customer satisfaction for audit services. Similarly, this study and previous studies, such as McDougall & Levesque(26), found that emotional value, such as peace of mind and reduced anxiety, significantly affect customer satisfaction, and Sheth et al.(26), defining emotional value as a key aspect of perceived value, is appropriate when emphasizing the importance of emotional value in enhancing customer satisfaction. Furthermore, this study shows that all five factors (QUV, VBP, HUV, EMV, SOV) have a positive impact on customer satisfaction. Previous studies, such as Sweeney & Soutar(20), which developed a multiple-item scale for perceived value including aspects such as quality, emotional response, reputation, and price, and Cronin et al.(12), found that perceived value, quality, and customer satisfaction are intimately interrelated, also acknowledging the multi-dimensional nature of perceived value and its impact on customer satisfaction.
However, the results of this study are also different from some studies, namely Behn et al.(31) which identified responsiveness and executive involvement as important, but less important than technical competence, in contrast to the findings of this study on Emotional Value ranked second. Cameran et al.(32) emphasize personal relationships and employee competencies in Italian professional services, which differs from this study’s findings on Lowest Impact Human Values. Although not directly referring to satisfaction, Hay & Knechel(33) highlighted the importance of auditor reputation in New Zealand, likely related to the Social Value factor in this study. Carcello et al.(34) found that the experience of the audit team and the audit firm was the most important, while this study showed that human value had the lowest influence. These differences in findings may be due to cultural differences, the specific context of the Hanoi audit market, changes in the profession over time, or methodological differences. This study provides valuable insights into the unique characteristics of the Hanoi audit market and contributes to a broader understanding of perceived value and customer satisfaction in professional services.
CONCLUSION
The research results show that there are 5 aspects of perceived value that affect customer satisfaction with the audit of financial statements performed by auditing companies in Hanoi city, arranged in descending order, as follows: Quality value, Emotional value, Value based on price, Social value, and Human value.
The findings from the empirical study are the basis for the author to make some recommendations, specifically as follows:
Emphasis on quality value
Audit firms should prioritize providing high quality audit services to enhance customer satisfaction. This includes ensuring the accuracy and reliability of audit reports, complying with relevant accounting standards and regulations, and maintaining a high level of technical competence among auditors. To achieve that, audit firms need to: Implement a rigorous quality control process; Provide ongoing training and development opportunities for auditors so they are always up to date with the latest accounting standards and audit techniques; Conduct regular internal audits to ensure the accuracy and reliability of audit reports.
Enhancement of emotional value
Audit firms need to provide a comfortable and reassuring audit experience to enhance customer satisfaction. This includes reducing customer anxiety and stress by providing clear and timely communication, and ensuring that the audit process is transparent and clearly explained. This will be achieved if audit firms establish a dedicated customer support team to address customer concerns and provide timely updates; Develop and implement clear communication protocols to ensure customers are kept informed throughout the audit; Provide post-audit meetings to discuss findings and make recommendations for improvement.
Optimizing value based on price
Audit firms should ensure their prices are competitive and that customers perceive good value for money. This includes providing a transparent and fair pricing structure and ensuring that the benefits received from audit services are appropriate to their costs. Companies need to focus on reviewing and adjusting the pricing structure to ensure competitiveness and transparency; Provide flexible pricing options to suit specific needs and budgets of customers; Clearly communicate the value of auditing services to customers, highlighting the benefits and cost savings.
Building Strong Customer Relationships (Human Values)
Audit firms should focus on building strong relationships with customers through courteous, professional service and quick responses. This includes providing personal attention, being approachable and easy to work with, and demonstrating trustworthiness. To achieve that, audit firms need to take the following steps, appointing dedicated managers to build and maintain close relationships with customers; Implementing customer feedback mechanisms to gather insights and address their concerns; Encouraging a customer-centric culture within the company, emphasizing the importance of personalized service and the ability to respond quickly.
Leveraging social value
Audit firms should emphasize the reputational benefits and social value of their services to their clients. This includes highlighting how the audit process improves the company’s reputation with stakeholders and enhances the company’s image in the business community. Audit firms need to take action steps, such as: Developing marketing materials that highlight the reputational benefits of partnering with the audit firm; Leveraging client testimonials and case studies to demonstrate the social value of the audit service; Communicating the reputation and achievements of the audit firm to build client trust.
Improving customer satisfaction with financial reporting audit services requires a holistic approach that focuses on providing high quality services, enhancing emotional value, optimizing prices, building close relationships with customers, and leveraging social value. By implementing these recommendations, independent auditing firms in Hanoi can enhance their competitive advantage, build long-term relationships with customers, and ultimately achieve higher levels of customer satisfaction.
Limitations of the study and proposed future research directions
This study only explains 60,10 % of the impact of perceived aspects on customer satisfaction of financial statement audit services. Thus, there are still other aspects that have not been studied that impact 39,90 % that further studies can explore. Future research should focus on identifying additional factors that may affect the level of customer satisfaction with the audit of financial statements. Future studies may explore the relative importance of these factors in different contexts or industries to understand how the impact of perceived value on customer satisfaction changes. In addition, longitudinal studies can look at how these relationships change over time.
Besides, this study is only limited to EFA analysis techniques. Therefore, further studies should be directed to discover more new factors, carry out further analysis techniques. At the same time, it is necessary to increase the sample size and expand the scope of the survey to have a more comprehensive view of customer satisfaction about the financial statement audit service.
REFERENCES
1. IAASB. International Standards on Auditing. International Federation of Accountants; 2018.
2. VACPA. Vietnam Association of Certified Public Accountants. 2020 [cited 2023]. Available from: http://www.vacpa.org.vn/
3. Kotler P, Keller KL. Marketing Management. 15th ed. Pearson; 2016.
4. Alnajjar B. Determinants of audit client satisfaction: An empirical investigation. Int J Audit. 2014;18(1):1-19.
5. Reichheld FF, Sasser WE. Zero defections: Quality comes to services. Harv Bus Rev. 1990;68(5):105-111.
6. Jones TO, Sasser WE. Why satisfied customers defect. Harv Bus Rev. 1995;73(6):88-99.
7. Louwers TJ, Ramsay RJ, Sinason DH, Strawser JR, Thibodeau JC. Audit quality and client satisfaction: Evidence from a large post-audit survey. Account Rev. 2018;93(1):1-22.
8. Causholli M, Reynolds-Moe L. Client satisfaction and audit quality. Auditing. 2011;30(2):1-22.
9. Knechel RW, Salterio SE, Ballou B. Auditors’ client acceptance decisions: A review and synthesis. Auditing. 2013;32(supp1):189-213.
10. Zeithaml VA. Consumer perceptions of price, quality, and value: A means-end model and synthesis of evidence. J Mark. 1988;52(3):2-22.
11. Chen CX, Yang TZ, Cheng CY. The impact of perceived audit quality on auditee satisfaction and loyalty: The mediating role of perceived value. Int J Audit. 2015;19(2):119-134.
12. Cronin JJ, Brady MK, Hult GTM. Assessing the effects of quality, value, and customer satisfaction on consumer behavioral intentions in service environments. J Retail. 2000;76(2):193-218.
13. Fornell C, Johnson MD, Anderson EW, Cha J, Bryant BE. The American Customer Satisfaction Index: Nature, purpose, and findings. J Mark. 1996;60(4):7-18.
14. Nguyen TT, Pham TT, Nguyen TA. The impact of service quality on customer satisfaction and loyalty in retail banking: Evidence from Vietnam. Int J Bank Mark. 2019;37(2):339-358.
15. Le TT, Ho TA, Nguyen TT. Determinants of customer satisfaction in e-commerce: A case study in Vietnam. J Electron Commer Res. 2020;21(2):125-142.
16. Hung PH. Audit Service Quality And Loyalty To Audit Firms: Empirical Evidence From Vietnam. J Posit Sch Psychol. 2022;6(7):5266-5281.
17. Tran TT, Nguyen TT, Ho TA. The role of perceived value in customer satisfaction and loyalty: Evidence from the legal services industry in Vietnam. J Serv Mark. 2020;34(2):217-232.
18. Monroe KB. Pricing: Making Profitable Decisions. New York: McGraw-Hill; 1990.
19. Sheth JN, Newman BI, Gross BL. Why we buy what we buy: A theory of consumption values. J Bus Res. 1991;22(2):159-170.
20. Sweeney JC, Soutar GN. Consumer perceived value: The development of a multiple item scale. J Retail. 2001;77(2):203-220.
21. Phạm HH. Đo lường chất lượng kiểm toán báo cáo tài chính thông qua ảnh hưởng của các nhân tố= Measurement of the auditquality of financial statements through the factors’ effects. 2022.
22. Huy HP, Mạnh DT. Ảnh hưởng của các nhân tố bên ngoài đến chất lượng kiểm toán của kiểm toán độc lập. Tạp chí Kinh tế và Phát triển. 2022;(299(2)):25-35.
23. Oliver RL. A cognitive model of the antecedents and consequences of satisfaction decisions. J Mark Res. 1980;17(4):460-469.
24. Fornell C. A national customer satisfaction barometer: The Swedish experience. J Mark. 1992;56(1):6-21.
25. Anderson EW, Fornell C, Lehmann DR. Customer satisfaction, market share, and profitability: Findings from Sweden. J Mark. 1994;58(3):53-66.
26. McDougall GHG, Levesque T. Customer satisfaction with services: Putting perceived value into the equation. J Serv Mark. 2000;14(5):392-410.
27. Adams JS. Towards an understanding of inequity. J Abnorm Soc Psychol. 1963;67(5):422-436.
28. Bolton RN, Lemon KN. A dynamic model of customers’ usage of services: Usage as an antecedent and consequence of satisfaction. J Mark Res. 1999;36(3):171-186.
29. Bollen KA. Overall fit in covariance structure models: Two types of sample size effects. Psychological bulletin. 1990 Mar;107(2):256-284.
30. Tabachnick BG, Fidell LS. Experimental designs using ANOVA. Belmont, CA: Thomson/Brooks/Cole; 2007 Dec 6.
31. Behn BK, Carcello JV, Hermanson DR, Hermanson RH. The determinants of audit client satisfaction among clients of Big 6 firms. Account Horiz. 1997;11(1):7-24.
32. Cameran M, Moizer P, Pettinicchio A. Customer satisfaction, corporate image, and service quality in professional services. Serv Ind J. 2010;30(3):421-435.
33. Hay D, Knechel WR. The effects of advertising and solicitation on audit fees. J Account Public Policy. 2010;29(1):60-81.
34. Carcello JV, Hermanson RH, McGrath NT. Audit quality attributes: The perceptions of audit partners, preparers, and financial statement users. Auditing. 1992;11(1):1-15.
FINANCING
The authors did not receive financing for the development of this research.
CONFLICT OF INTEREST
The authors declare that there is no conflict of interest.
AUTHORSHIP CONTRIBUTION
Conceptualization: Pham Huy Hung, Vu Thuy Ha.
Data curation: Vu Thuy Ha.
Formal analysis: Pham Huy Hung.
Research: Pham Huy Hung.
Methodology: Vu Thuy Ha.
Project management: Pham Huy Hung, Vu Thuy Ha.
Resources: Pham Huy Hung.
Supervision: Vu Thuy Ha.
Validation: Pham Huy Hung.
Display: Vu Thuy Ha, Pham Huy Hung.
Drafting - original draft: Pham Huy Hung, Vu Thuy Ha.
Writing - proofreading and editing: Pham Huy Hung, Vu Thuy Ha.
APPENDIX 1
Attribute coding of the influence of perceived value on customer satisfaction with financial statement audit services
|
No. |
Code |
Internal category of survey questions |
Source |
|
I |
Quality value (QUV) |
||
|
1 |
QUV1 |
The audit report provided by the auditor is accurate and reliable |
(11) |
|
2 |
QUV2 |
The auditor’s technical competence is high |
(19) |
|
3 |
QUV3 |
The audit process is thorough and comprehensive |
(4) |
|
4 |
QUV4 |
The audit report meets all relevant accounting standards and regulations |
(7) |
|
5 |
QUV5 |
The audit findings are clear and easy to understand |
(26) |
|
II |
Value based on price (VBP) |
||
|
6 |
VBP1 |
The audit fees are reasonable given the quality of the service |
(13) |
|
7 |
VBP2 |
The audit service provides good value for money |
(20) |
|
8 |
VBP3 |
The cost of the audit is justified by the benefits received |
(12) |
|
9 |
VBP4 |
The audit fees are competitive compared to other audit firms |
(28) |
|
10 |
VBP5 |
The audit service is worth the price paid |
(10) |
|
III |
Human value (HUV) |
||
|
11 |
HUV1 |
The auditor is courteous and professional |
(19) |
|
12 |
HUV2 |
The auditor is responsive to my needs and concerns |
(4) |
|
13 |
HUV3 |
The auditor is trustworthy and reliable |
(7) |
|
14 |
HUV4 |
The auditor is approachable and easy to work with |
(11) |
|
IV |
Emotional value (EMV) |
||
|
15 |
EMV1 |
The audit process reduces my anxiety about the accuracy of the financial statements |
(19) |
|
16 |
EMV2 |
The audit process reduces my stress and uncertainty |
(11) |
|
17 |
EMV3 |
The audit process is reassuring and comforting |
(4) |
|
18 |
EMV4 |
The audit findings provide me with a sense of security |
(7) |
|
19 |
EMV5 |
The audit report gives me peace of mind |
(26) |
|
V |
Social value (SOV) |
||
|
20 |
SOV1 |
Engaging with this audit firm enhances my company’s reputation |
(20) |
|
21 |
SOV2 |
The audit process improves my company’s credibility with stakeholders |
(28) |
|
22 |
SOV3 |
The audit report strengthens my company’s image in the business community |
(13) |
|
23 |
SOV4 |
The audit process builds trust with our investors and lenders |
(12) |
|
24 |
SOV5 |
The audit firm’s reputation adds value to my company’s brand |
(10); (11) |
|
VI |
Customer satisfaction (CUSA) |
||
|
25 |
CUSA1 |
I am satisfied with the overall audit process |
(23) |
|
26 |
CUSA2 |
The audit service met my expectations for accuracy and reliability |
(3) |
|
27 |
CUSA3 |
I am satisfied with the quality of the audit report |
(13) |
|
28 |
CUSA4 |
The audit findings provided useful insights for improving our financial reporting |
(26) |
|
29 |
CUSA5 |
I would recommend this audit firm to others based on my satisfaction with their service |
(12) |