doi: 10.56294/sctconf2024.1395
ORIGINAL
A study on the factors influencing sustainable social media consumption among Generation Z through sustainability, ease of use, trust, social influence, and subscription convenience concerning YouTube Streaming
Un estudio sobre los factores que influyen en el consumo sostenible de redes sociales entre la Generación Z a través de la sostenibilidad, la facilidad de uso, la confianza, la influencia social y la conveniencia de la suscripción en relación con YouTube Streaming
Rashmi Mishra1 ![]() , Deepika Varshney2
, Deepika Varshney2 ![]() , Fredrick Kayusi3,4
, Fredrick Kayusi3,4 ![]()
1University of Technology and Applied Sciences, College of Economics and Business Administration. Al Musanna, Oman.
2University of Technology and Applied Sciences, College of Engineering. Al Musanna, Oman.
3Maasai Mara University, Department of Environmental Studies, Geography and Planning. Narok, Kenya.
4Pwani University, Department of Environmental Sciences. Kilifi, Kenya.
Cite as: Mishra R, Varshney D, Kayusi F. A study on the factors influencing sustainable social media consumption among Generation Z through sustainability, ease of use, trust, social influence, and subscription convenience concerning YouTube Streaming. Salud, Ciencia y Tecnología - Serie de Conferencias. 2024; 3:.1395. https://doi.org/10.56294/sctconf2024.1395
Submitted: 15-05-2024 Revised: 26-09-2024 Accepted: 28-11-2024 Published: 29-11-2024
Editor:
Dr.
William Castillo-González ![]()
ABSTRACT
Introduction: the increase in Software as a Service (SaaS) revolutionized streaming services and changed how people consume digitally. Most of these facilities use massive amounts of energy, which raises concerns about the environment and social impact of the technology. The study examines how awareness of sustainability, ease of use, social influence, trust, and subscription convenience drive sustainable streaming behavior among Generation Z, reducing environmental strain.
Method: a quantitative research approach was used to investigate the factors influencing responsible streaming behavior among Generation Z. Participants were recruited using a non-probability convenience sampling method. The 206 responses were collected from students aged 18 to 25 studying in Higher Educational Institutions from different academic departments in India.
Results: the findings reveal that streaming platforms must increase sustainability awareness through campaigns to promote sustainable streaming behavior. Ease of use is essential, suggesting that user-friendly features encourage responsible actions like reducing video quality or downloading videos. Social influence is a strong predictor, emphasizing the role of peer norms and societal expectations in promoting sustainable, responsible streaming behaviors.
Conclusions: streaming services can use peer recommendations and community engagement to promote responsible, sustainable streaming behavior among Generation Z. Streaming services have a social impact by offering access to diverse content and contribute to issues like excessive screen time and algorithm-driven information that limit exposure to different opinions. To mitigate these social impacts, platforms should introduce screen time reminders and enhance algorithms to promote balanced, inclusive content, ensuring that streaming continues as a positive and developing societal factor.
Keywords: Digital Consumption; Energy Consumption; Generation Z; Streaming Behavior; Sustainability; Social Impact of Technology.
RESUMEN
Introducción: el aumento del software como servicio (SaaS) revolucionó los servicios de streaming y cambió la forma en que las personas consumen digitalmente. La mayoría de estas instalaciones utilizan enormes cantidades de energía, lo que genera preocupación sobre el medio ambiente y el impacto social de la tecnología. El estudio examina cómo la conciencia de la sostenibilidad, la facilidad de uso, la influencia social, la confianza y la conveniencia de las suscripciones impulsan un comportamiento de transmisión sostenible entre la Generación Z, reduciendo la tensión ambiental.
Método: se utilizó un enfoque de investigación cuantitativa para investigar los factores que influyen en el comportamiento de transmisión responsable entre la Generación Z. Los participantes fueron reclutados utilizando un método de muestreo no probabilístico por conveniencia. Las 206 respuestas se recopilaron de estudiantes de entre 18 y 25 años que estudiaban en instituciones de educación superior de diferentes departamentos académicos de la India.
Resultados: los hallazgos revelan que las plataformas de streaming deben aumentar la conciencia sobre la sostenibilidad a través de campañas para promover un comportamiento de streaming sostenible. La facilidad de uso es esencial, lo que sugiere que las funciones fáciles de usar fomentan acciones responsables como reducir la calidad del video o descargar videos. La influencia social es un fuerte predictor, lo que enfatiza el papel de las normas de los pares y las expectativas sociales en la promoción de comportamientos de transmisión sostenibles y responsables.
Conclusiones: los servicios de streaming pueden utilizar recomendaciones de pares y la participación de la comunidad para promover un comportamiento de streaming responsable y sostenible entre la Generación Z. Los servicios de streaming tienen un impacto social al ofrecer acceso a contenido diverso y contribuyen a problemas como el tiempo excesivo frente a la pantalla y la información basada en algoritmos que limitan la exposición. a opiniones diferentes. Para mitigar estos impactos sociales, las plataformas deberían introducir recordatorios del tiempo de pantalla y mejorar algoritmos para promover contenido equilibrado e inclusivo, garantizando que la transmisión continúe como un factor social positivo y en desarrollo.
Palabras clave: Consumo Digital; Consumo de Energía; Generación Z; Comportamiento de Transmisión; Sostenibilidad; Impacto Social de la Tecnología.
INTRODUCTION
Streaming has transformed how people access media by providing instant, on-demand content delivery over the Internet without requiring downloads. It transmits compressed data in small chunks that are buffered and played in real-time, enabling seamless consumption across various devices.(1) Data from the International Telecommunication Union (ITU), shows the consistent rise in global internet usage from 2005 to 2024. Over the years, internet users have grown from less than 1 billion in 2005 to more than 4 billion by 2024. Simultaneously, the percentage of the global population using the Internet has surpassed 60 %. This growth reflects the increasing penetration of digital technologies across the globe, driven by improved internet infrastructure, more affordable devices, and the growing importance of online platforms in daily activities.(2) In the 1990s, with innovations like RealNetworks, audio streaming increased with platforms like YouTube and Netflix in the 2000s, and streaming became an integral part of global entertainment, education, and communication.(3) Whether watching a film, listening to music, or attending virtual events, streaming provides diverse audiences convenience and accessibility. The surge in digital streaming platforms has fundamentally transformed global content consumption habits. Platforms like YouTube have created an ecosystem where users can access a vast library of videos, enabling convenience and accessibility like never before. However, this digital convenience comes at a cost. The energy demands of video streaming, including data center operations and high-definition video delivery, contribute significantly to the carbon footprint of the digital economy.(4) Video streaming services have transformed entertainment consumption by allowing users to access content anytime and anywhere, replacing traditional practices such as waiting for scheduled TV shows or purchasing CDs for individual films. Despite the platform’s investments in energy-efficient technologies and renewable energy sources, the user’s role in adopting responsible streaming behaviors has been largely overlooked. Actions such as reducing video quality, downloading content for offline viewing, and avoiding idle streaming can potentially mitigate energy consumption significantly.(5) Understanding the behavioral drivers behind these actions is critical for aligning user habits with broader sustainability goals. As one of the most active demographics on platforms like YouTube, university students represent an ideal group for studying these behaviors. This study aims to examine the social impact of streaming on sustainability by analyzing how awareness of sustainability, ease of use, social influence, trust, and subscription convenience drive sustainable, responsible streaming behavior among Generation Z, contributing to reducing environmental strain in the digital streaming ecosystem. Addressing this gap is vital for creating a more sustainable digital consumption landscape.
Literature review and hypotheses development
The rising popularity of streaming platforms like YouTube has highlighted their environmental impact. These platforms depend on an extensive ICT infrastructure, including data centers, networks, and user devices, which consume considerable energy. This reliance makes it essential to adopt sustainable practices to reduce the carbon footprint of streaming activities.(6) The digital streaming ecosystem has transformed content consumption behaviors, particularly among younger demographics. Platforms like YouTube play a significant role in shaping these behaviors through their user-friendly features and widespread accessibility. However, understanding the behavioral drivers that promote responsible streaming practices is critical with streaming’s increasing environmental impact.
Social influence on streaming behavior
Social influence refers to the impact of peer behavior, societal norms, and social media on individual decisions. Social influence plays a significant role in shaping the digital consumption habits of Generation Z, as peer norms and social media strongly affect their choices regarding streaming platforms. The perceived value of streaming platforms is shaped by a combination of cognitive and social factors that influence consumer behavior. It highlights content quality, relevance, variety, enjoyment, and the cost-benefit ratio in shaping subscription intentions. Along with personalization and technical reliability, these factors enhance user satisfaction and loyalty, making them critical to engagement strategies.(7) A study on streaming behaviors among college students highlights that sharing account passwords and using unauthorized platforms are often driven by peer encouragement and low-risk perception. These findings underscore the need to leverage social campaigns and platform designs to promote sustainable user behavior.(8) As per the study,(9) MMOG live streaming highlights that social influence, including self-presentation, parasocial relationships, and platform loyalty, significantly shapes viewer behavior. These factors drive engagement, particularly in virtual gifting, and parallel user behaviors observed in broader digital ecosystems. As per the study of(10) live-stream commerce has shown that attributes like dynamic characteristics, perceived interactivity, and atmosphere clues significantly influence user engagement. Immersive experiences and social interactions mediate these effects, with increasing purchase intention. These findings highlight the importance of interactive communication and environmental signs in shaping digital behaviors.(11) Study highlights the dual impact of social and behavioral influences on digital streaming practices. Excessive streaming behaviors, as studied in(11) often come from a combination of cognitive-behavioral symptoms, such as compulsive use and mood regulation, alongside external social pressures. Adolescents are heavily influenced by peer norms and environmental factors, which shape their streaming habits and can lead to negative consequences, such as anxiety and loneliness. Social influence plays a critical role in shaping user behaviors on digital platforms. Drawing from self-categorization theory, group identity and norms significantly impact individual decision-making and engagement patterns.(12) Shows that individuals who strongly identify with a group are more likely to conform to group norms, perceiving these norms as valid sources of information. Social influence is powerful in digital spaces, especially on platforms like YouTube, where peer recommendations and group approval shape how users discover and engage with content. These social dynamics often guide behaviors such as watching, sharing, and adopting new habits, including sustainable practices. Surprisingly, the anonymity of online interactions tends to strengthen group bonds rather than weaken them, making group identity even more influential in shaping user actions. Social influence plays a significant role in shaping consumer behaviors in digital consumption, mainly through platforms that foster interactive and parasocial relationships on(13) food live-streaming shopping, such as mukbang videos, highlights the impact of influencers and channel factors on consumer behavior. Studies shows that credible influencers and parasocial relationships significantly enhance perceived value, leading to impulse purchases and overconsumption, regardless of the promoted food type. Furthermore, channel factors, such as product offerings and platform convenience, amplify these effects on purchasing behavior and broader consumption patterns. Generational identity significantly shapes how users adopt and engage with technologies(14) highlight “technological eclecticism,” where individuals blend analog and digital formats in their consumption habits, showing how cultural practices and social norms drive media engagement behaviors. Based on the literature, the following hypothesis is proposed: H01: there is a significant relationship between social influence and responsible streaming behavior.
Ease of use and user behavior
Ease of use incorporates the simplicity and intuitiveness of a platform’s features, which enable users to adopt desired behaviors without discomfort.(15) suggests that platforms with user-friendly designs encourage actions like adjusting video quality or downloading content for offline viewing.(16) study highlights the growing importance of YouTube as a platform for self-learning and e-learning, particularly during the COVID-19 pandemic. A study targeting online university students in Jordan revealed that users’ behavioral intention to adopt e-learning was positively influenced by performance expectancy, perceived usefulness, and ease of use. Using frameworks of the Technology Acceptance Model (TAM) and the Unified Theory of Acceptance and Use of Technology (UTAUT), the study underscored the critical role of ease of use in shaping users’ willingness to engage with digital platforms. YouTube has become an essential educational tool students and educators use to enhance learning. Among these, perceived usefulness significantly impacted shaping students’ attitudes toward learning through YouTube. Additionally, the study revealed a strong link between students’ intention to use YouTube and their actual adoption of it as an educational tool. These findings suggest that features promoting usefulness and accessibility are essential for encouraging the adoption of educational streaming platforms.(17) Theories of practice justify understanding consumer behavior for the streaming platforms.(18) analyses traditional individualistic consumption models, emphasizing the role of routines, habits, and material contexts in shaping behavior. These factors are relevant to streaming platforms like YouTube, where user engagement often comes from habitual viewing patterns and the material affordances of digital technologies. By focusing on the interplay between cultural norms and daily practices, this perspective shifts the focus from individual decision-making to the broader social and material structures that sustain consumption. The research shows that ease of use is a key driver of responsible streaming behavior, reflecting its influence on user satisfaction and platform engagement.(19) In digital ecosystems, ease of use is a key determinant of user engagement and behavioral adoption. Very scant studies have been done to link ease of use among Generation Z to sustainability, creating a gap in understanding of how platforms can be designed for both convenience and environmental impact reduction. So, to explore further we propose the following hypothesis: H02: there is a significant relationship between Ease of use and responsible streaming behavior.
Sustainability awareness in digital consumption
Awareness of sustainability refers to how users understand the environmental implications of their streaming behaviors. While many users recognize the general importance of sustainability, translating awareness into action remains a challenge;(20) research highlights that awareness campaigns can influence behaviors, but their impact varies depending on the availability of actionable options. Sustainability awareness influences users’ decisions and behaviors when streaming digital content. Previous literature has shown that the information and communication technology sector, particularly video streaming, significantly contributes to global CO2 emissions.(21) A study combining life cycle assessment (LCA) with user behavior analysis revealed that factors such as the choice of device, streaming resolution, and duration directly impact the environmental footprint of streaming. For example, streaming on a smart TV can generate ten times more CO2 emissions than a smartphone. The study also highlights the importance of provider-side interventions, such as setting default lower resolution options, which can significantly reduce energy consumption on the user side. However, the integration of user behavior into environmental assessments like LCA remains limited due to a lack of quantitative data on streaming habits. Addressing this gap requires interdisciplinary approaches that combine technological and behavioral analyses.(22) Streaming platforms, particularly those employing adaptive video streaming, contribute significantly to energy consumption and environmental degradation. Adaptive streaming dynamically adjusts video quality to network conditions, ensuring seamless playback. However, the demand for high resolutions and prolonged streaming sessions escalates energy usage in client devices and server infrastructures. These environmental concerns underline the importance of user-driven sustainable practices, such as reducing streaming resolutions and durations.(23) Streaming platforms like YouTube heavily rely on data centers to store, process, and deliver vast amounts of video content. While these facilities enable seamless user experiences, they significantly contribute to environmental challenges. Data centers account for 1,5 % of global electricity consumption, with streaming services major contributors to this(24) the reliance on energy-intensive operations, such as cooling systems and server maintenance, adds to their carbon footprint, emphasizing the need for sustainable solutions. User behavior plays a significant role in the environmental footprint of digital streaming platforms.(25) The rising demand for mobile data transfer, driven by high-resolution streaming and prolonged usage, has increased energy consumption despite mobile network technologies like 4G and 5G advancements. While these technologies have reduced energy intensity per data unit, overall energy use continues to rise due to growing data traffic and consumer demands. The study further highlights the importance of addressing user behaviors, such as opting for lower resolutions and reducing streaming durations, to mitigate environmental impacts. Additionally, adopting a life cycle perspective is essential to assess the broader implications, including those from data centers, telecommunication networks, and end-user devices. These findings underscore the critical need for user-focused interventions on streaming platforms like YouTube to align consumer behaviors with global sustainability goals. There is a gap in understanding how awareness interacts with other factors, such as ease of use or social influence, in driving responsible streaming to explore further, we formulated the following hypothesis: H03: there is a significant relationship between Awareness of sustainability and responsible streaming behavior.
Trust in platform sustainability
Bhalla(26) highlights that environmental concerns strongly influence attitudes and intentions toward collaborative consumption, while economic motivations are less significant. Materialistic traits and perceived risks act as barriers, emphasizing the need to address consumer concerns. Attitude is a key mediator between motivations, constraints, and intentions. Although institution-based trust impacts collaborative consumption directly, it does not moderate the relationship. These findings suggest businesses should focus on sustainability messaging, enhance consumer experiences, and prioritize trust-building through better security measures to engage consumers who value experiences over possessions. Trust in a platform’s sustainability initiatives influences whether users believe their actions align with broader environmental goals. Study indicates that users are more likely to adopt sustainable practices if they trust the platform’s claims and features.(27) Using dynamic capability theory, examined how digital platforms support sustainability through stakeholder interaction, resource building, and value co-creation. Their study shows how platforms can build trust by addressing sustainability issues and empowering users. Identifying stakeholder needs and fostering collaboration highlights the role of transparency and engagement in aligning user actions with sustainability goals.(28) However, trust’s direct impact on user behavior in digital streaming contexts is underexplored, particularly for platforms like YouTube that emphasize user experience over explicit sustainability messaging. So, we propose the following hypothesis to explore further: H04: there is a significant relationship between trust in platform sustainability and responsible streaming behavior.
Subscription convenience
The rapid proliferation of Over-the-Top streaming services has transformed global media consumption, reshaping traditional viewing habits and business models. The adoption of Over-the-Top (OTT) video streaming services has reshaped consumer behavior, especially in diverse markets like India.(29) A study explored factors influencing subscription decisions, identifying key drivers such as content, convenience, features, price, and quality. Price showed an inverse effect, highlighting its significance in user choices. Despite growing digital consumption, traditional television remains dominant in rural areas due to family viewing habits and local content preferences. The study’s findings emphasize the need for streaming platforms to address adoption drivers and barriers, helping them meet user expectations and improve engagement.(30) A comprehensive literature review was conducted to identify twelve key factors influencing OTT adoption: content, price, convenience, perceived enjoyment, binge-watching, and socialization. These factors highlight the evolving consumer preference for personalized, on-demand content driven by the ubiquity of internet access and the flexibility offered by digital platforms. Technological advancements like Smart TVs and mobile streaming have also bridged traditional and digital media, enabling consumers to access high-quality content across devices. While OTT platforms gradually replace traditional Pay-TV services in many markets, the dynamics vary regionally. Subscription convenience includes affordability, flexibility, and ease of access, indirectly shaping user engagement. While research often associates convenience with overall user satisfaction, its connection to responsible streaming behavior remains underexplored. Addressing this gap is essential to explore whether subscription models can incentivize sustainable consumption behaviors, so we proposed the following hypothesis: H05: there is a significant relationship between subscription convenience and responsible streaming behavior.
Based on the literature review, we proposed the following conceptual model of figure 2 to investigate further analysis:
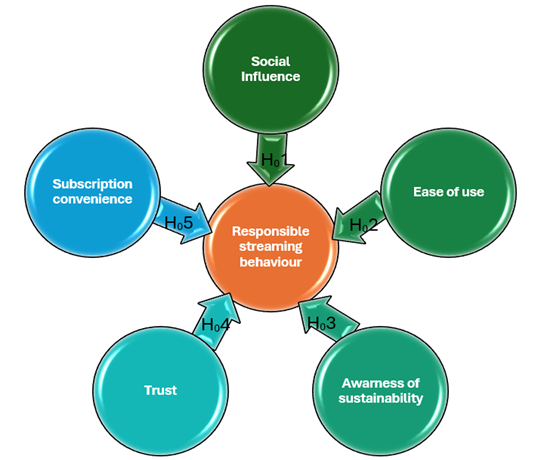
Source: the Independent variable is taken from,(8,9,17,22,28,29,30) and the dependent variable is taken from(18,19)
Figure 1. Conceptual Model
METHOD
In our study, we used the sequential exploratory design approach, consisting of a qualitative phase followed by a quantitative one. The qualitative phase involved data collection using semi-structured interviews and focus group discussions. The findings of the qualitative study guided the quantitative phase, and a survey was administered. The survey instrument is developed from an exhaustive literature review of studies conducted in India and other countries worldwide, along with the interview and focus group discussion findings. This ensured that our survey instrument is valid, reliable, ethical, and bias-free, considering this study concerned human subjects. Ethical considerations were observed in the data collection process by obtaining informed consent from the participants. This study ensured anonymity, confidentiality, voluntary participation, and participants’ privacy. We used a quantitative research design to investigate the factors influencing responsible streaming behavior among Generation Z. The research focused on five predictors: social influence, ease of use, awareness of sustainability, trust, and subscription convenience. Data was collected from May 2024 to September 2024 using a structured questionnaire distributed through WhatsApp groups and direct contact with students. A non-probability convenience sampling method was used to recruit participants.(31) The target population included students aged between 18 and 25 from higher education institutions in India, among different academic departments. 206 responses were collected, exceeding the required sample size of 138, as determined by G*Power 3.1.9.7. The sample size was calculated using the following parameters: an effect size of 0,15 (medium), a significance level of 0,05, a power of 0,95, and five predictors. The structured questionnaire consisted of two sections: demographic information (e.g., age, gender, education level, frequency of usage and purpose of the usage) and study variables (Social influence, ease of use, awareness of sustainability, trust, and subscription convenience). Responses were collected using a 5-point Likert scale ranging from 1 (Strongly Disagree) to 5 (Strongly Agree). During the development of the instruments, a pilot study of 30 participants was carried out, and the feedback was used to modify some of the questions to ensure reliability. Once effectiveness was satisfactorily achieved, the questionnaires were distributed to students. Data analysis is done by SPSS 30.0. Descriptive statistics summarized demographic data and provided an overview of responses. At the same time, multiple regression analysis tested the relationships between the independent variables (Social influence, ease of use, awareness of sustainability, trust, and subscription convenience) and the dependent variable (Responsible streaming behavior). The regression model was validated to ensure sufficient statistical power and accurate interpretation of results.
RESULTS
|
Table 1. Descriptive Statistics |
|||
|
|
Categories |
Numbers |
Percentage |
|
Gender |
Male |
117 |
57 |
|
Female |
89 |
43 |
|
|
Total |
|
206 |
100 |
|
Education |
Business |
94 |
46 |
|
|
Information Technology |
25 |
12 |
|
|
Engineering |
23 |
11 |
|
|
Medical |
22 |
11 |
|
|
Law |
15 |
7 |
|
|
Arts |
27 |
13 |
|
Total |
|
206 |
100 |
|
Frequency of usage |
Multiple times a day |
140 |
68 |
|
|
Once or twice a day |
35 |
17 |
|
|
A few times a week |
31 |
15 |
|
Total |
|
206 |
100 |
|
Usage Purpose |
Music/Podcasts |
107 |
52 |
|
|
Education/Study |
60 |
29 |
|
|
News/Information |
39 |
19 |
|
Total |
|
206 |
100 |
The descriptive statistics for the study reveal that among the 206 respondents, 57 % are male, and 43 % are female. Regarding education, the majority, 46 %, are enrolled in business programs, followed by arts 13 % and information technology 12 %, with smaller representation in engineering, medical, and law fields. Regarding the frequency of usage, 68 % of participants reported streaming multiple times a day, while 17 % stream once or twice daily, and 15 % stream a few times a week. For usage purposes, music and podcasts dominate with 52 %, followed by education or study purposes at 29 % and news or information at 19 %.
Inferential Statistics
Regression analysis is a statistical method to explore the relationship between dependent and independent variables. However, before conducting regression analysis, it is essential to ensure that the data is both valid and reliable.(32) Reliability refers to the consistency of measurements, ensuring that repeated analyses produce similar results and demonstrating the reproducibility of findings.(32,33,34) Validity ensures that the relationships identified in the study genuinely reflect real-world connections between variables, as validity issues can lead to misleading or inaccurate results.(32) Cronbach’s Alpha is a commonly used measure to assess internal consistency, verifying whether items in a scale measure the same construct. The interpretation of Cronbach’s Alpha values is as follows: α ≥ 0,9 is excellent, 0,7 ≤ α < 0,9 is good, 0,6 ≤ α < 0,7 is acceptable, 0,5 ≤ α < 0,6 is poor, and α < 0,5 is unacceptable.(32)
|
Table 2. Test of Reliability |
|||
|
No. |
Variables |
No. of Construct |
Cronbach's Alpha |
|
1 |
Awareness of sustainability (As) |
3 |
0,755 |
|
2 |
Ease of Use (Eou) |
3 |
0,837 |
|
3 |
Trust (Tyt) |
3 |
0,810 |
|
4 |
Subscription Convenience (Cs) |
3 |
0,829 |
|
5 |
Social Influence (Si) |
3 |
0,770 |
|
6 |
Responsible Streaming Behaviour (Rsb) |
3 |
0,794 |
The test of reliability results from table 2 shows that all factors on the scale have a high level of internal consistency reliability; the values of Cronbach’s alpha range from a minimum of 0,755 to a maximum of 0,837. The Cronbach’s alpha levels show that the measurement instrument used in the survey had good reliability, and all factors show acceptable levels of internal consistency. To continue the further test, we need to do the naming of the variables, which is shown in table 3 below.
|
Table 3. Naming of the Variables |
|
“MeanAs” - composite variable from “Awareness of sustainability” |
|
“MeanEou”- composite variable from “Ease of Use” |
|
“MeanTyt”- composite variable from “Trust” |
|
“Mean Cs” - composite variable from “Subscription Convenience” |
|
“Mean Si” - composite variable from “Social Influence” |
|
“MeanRsb” - composite variable from “Responsible Streaming Behaviour” |
Table 3 presents the composite variables used in the study, derived by averaging the scores of related survey items for each construct. “MeanAs” represents Awareness of sustainability, “MeanEou” reflects Ease of Use, “MeanTyt” corresponds to Trust, “MeanCs” measures Subscription Convenience, and “MeanSi” captures Social Influence. The dependent variable, “MeanRsb,” represents Responsible Streaming Behavior.
|
Table 4. Pearson Correlations |
||||||
|
Variables |
Mean (As) |
Mean (Eou) |
Mean (Tyt) |
Mean (Cs) |
Mean (Si) |
Mean (Rsb) |
|
1 |
0,567** |
0,579** |
0,522** |
0,561** |
0,497** |
|
|
Ease of Use Mean(Eou) |
0,567** |
1 |
0,562** |
0,676** |
0,557** |
0,550** |
|
Trust Mean(Tyt) |
0,579** |
0,562** |
1 |
0,542** |
0,623** |
0,494** |
|
Subscription Convenience Mean (Cs) |
0,522** |
0,676** |
0,542** |
1 |
0,555** |
0,493** |
|
Social Influence Mean(Si) |
0,561** |
0,557** |
0,623** |
0,555** |
1 |
0,541** |
|
Responsible Streaming Behaviour Mean(Rsb) |
0,497** |
0,550** |
0,494** |
0,493** |
0,541** |
1 |
|
Note: N=206. P<0,01 (2-tailed) |
||||||
The Pearson correlation analysis from table 4 highlights significant positive relationships between the independent variables and Responsible Streaming Behavior (Mean Rsb). Social Influence (Mean Si) shows the strongest correlation (r = 0,541, p < 0,001), emphasizing the role of peer norms and recommendations in shaping user behavior. Ease of Use (Mean Eou) also displays a strong positive relationship with Mean Rsb (r = 0,550, p < 0,001), indicating that platforms that are easy to navigate encourage more responsible use. Awareness of sustainability (Mean As), Trust (Mean TYt), and Subscription Convenience (Mean Cs) show moderate correlations with Mean Rsb (r = 0,497, r = 0,494, and r = 0,493, respectively), suggesting these factors play a supporting role in driving responsible streaming. However, none of these correlations shows multicollinearity. To progress further, we will check the Coefficients table results and additional Collinearity Statistics to continue our study. It is important to note that the tolerance level of the variables should be 0,1 or more. It indicates how much a particular variable is not explained by others. The second important point at this stage is to check the Variance Inflation Factor (VIF). It should be less than 5. It estimates how much multicollinearity increases the regression model’s variance.(35)
|
Table 5. Collinearity Statistics |
|||
|
Variables |
Tolerance |
VIF |
|
|
1 |
Awareness of sustainability |
0,544 |
1,837 |
|
Ease of use |
0,452 |
2,211 |
|
|
Trust |
0,499 |
2,003 |
|
|
Subscription Convenience |
0,479 |
2,088 |
|
|
Social Influence |
0,506 |
1,978 |
|
|
Note: a. Dependent Variable: Responsible streaming behavior |
|||
The collinearity statistics of table 5 for the independent variables Awareness of sustainability, Ease of Use, Trust, Subscription Convenience, and Social Influence show no multicollinearity. Tolerance values ranged from a minimum of 0,452 to a maximum of 0,544, which is above the threshold of 0,1 and shows that independent variables are not highly correlated with others. Also, the Variance Inflation Factor (VIF) values, ranging between a minimum of 1,837 and a maximum of 2,211, are less than the accepted threshold of 5.(35) These results suggest that the predictors are sufficiently independent and that their individual contributions to the regression model are reliable. We now evaluate our model further by checking the model summary from table 6.
|
Table 6. Model Summaryb |
||||||||||
|
Model |
R |
R Square |
Adjusted R Square |
Std. Error of the Estimate |
Change Statistics |
Durbin-Watson |
||||
|
R Square Change |
F Change |
df1 |
df2 |
Sig. F Change |
||||||
|
1 |
0,639a |
0,409 |
0,394 |
2,30778 |
0,409 |
27,660 |
5 |
200 |
<0,001 |
1,987 |
|
Note: a. Predictors: (Constant), Social Influence, Subscription convenience, Awareness of Sustainability, Trust, Ease of Use. b. Dependent Variable: Responsible Streaming Behavior |
||||||||||
In the first column of table 6, our R value shows the correlation coefficient between a dependent variable and independent variables; we have a value of (0,639), and it shows a moderate positive relationship between variables. The next column of our table presents the level of R square, which shows the proportion of variance in the dependent variable, which is explained by predicting variables. In our case, the level of R square is (0,409) or 40,9 %, which shows that the independent variables explain 40,9 % of the variance in Responsible streaming behavior (Rsb). The adjusted R square provides a more accurate estimation of the variance explained by our model by taking the sample size and number of predictors into account. The value for this model of adjusted R square is 0,394 or 39,4 %, and it indicates that after adjusting for the number of predictors, the model explains 39,4 % of the variance in responsible streaming behavior (Rsb). F Change (27,660, p < 0,001): The model is statistically significant, indicating that the independent variables collectively explain a substantial portion of the variance in the dependent Variable. Durbin-Watson (1,987): Indicates no significant autocorrelation in the residuals, suggesting the model assumptions are met. In the next stage, we will analyze the results from the ANOVA table 6 to check the significance of our model at a p-value less than 0,05; it will allow us to mention that our model is a good prediction tool.(32)
|
Table 7. ANOVAa |
||||||
|
Model |
Sum of Squares |
df |
Mean Square |
F |
Sig. |
|
|
1 |
Regression |
736,555 |
5 |
147,311 |
27,660 |
<0,001b |
|
Residual |
1065,174 |
200 |
5,326 |
|
|
|
|
Total |
1801,728 |
205 |
|
|
|
|
|
Note: a. Dependent Variable: Responsible Streaming Behavior. b. Predictors: (Constant), Social Influence, Subscription convenience, Awareness of Sustainability, Trust, Ease of Use |
||||||
From table 7, the F-statistic (27,660, p < 0,001) confirms that the regression model is statistically significant, meaning the Independent Variables collectively influence the Dependent Variables. We can now proceed with our study to test the hypotheses from table 7. We have five hypotheses that were checked by conducting regression analysis.
|
Table 8. Coefficientsa |
||||||
|
Model |
Unstandardized Coefficients |
Standardized Coefficients |
t |
Sig. |
||
|
B |
Std. Error |
Beta |
||||
|
1 |
(Constant) |
3,003 |
0,770 |
|
3,899 |
<0,001 |
|
MeanAs |
0,159 |
0,085 |
0,138 |
1,873 |
0,063 |
|
|
MeanEou |
0,215 |
0,074 |
0,234 |
2,892 |
0,004 |
|
|
MeanTYt |
0,097 |
0,078 |
0,097 |
1,255 |
0,211 |
|
|
MeanCs |
0,078 |
0,072 |
0,086 |
1,089 |
0,277 |
|
|
MeanSi |
0,217 |
0,074 |
0,225 |
2,944 |
0,004 |
|
|
Note: a. Dependent Variable: Responsible Streaming Behavior |
||||||
From table 8: Constant (3,003): this represents the baseline value of responsible streaming behavior when all Independent Variables are zero. Significant Predictors (p < 0,05): Ease of Use (MeanEou): [B=0,215, p=0,004] Positive and significant influence, indicating that ease of platform features promotes responsible behavior. Social Influence (MeanSi): [B=0,217, p=0,004]; Strong positive influence, showing that social norms significantly impact responsible streaming behavior. Non-Significant Predictors (p > 0,05): Awareness of Sustainability (MeanAs): [p=0,063] (close to significance but not statistically significant). Trust in YouTube (MeanTYt): [p=0,211] Convenience of Subscription (MeanCs): [p=0,277].
DISCUSSION
|
Table 9. Results of the Hypotheses |
||
|
No. |
Hypotheses are tested as Null Hypotheses |
Results |
|
1. |
H01: there is no significant relationship between social influence and responsible streaming behavior. |
Rejected |
|
2. |
H02: there is no significant relationship between ease of use and responsible streaming behavior. |
Rejected |
|
3. |
H03: there is no significant relationship between awareness of sustainability and responsible streaming behavior. |
Accepted |
|
4. |
H04: there is no significant relationship between trust in platform sustainability and responsible streaming behavior. |
Accepted
|
|
5. |
H05: there is no significant relationship between subscription convenience and responsible streaming behavior. |
Accepted |
Table 9 summarizes the hypotheses testing results. It shows significant relationships between social influence, ease of use, and responsible streaming behavior, but sustainability awareness, trust, and subscription convenience had no significant impact. These findings show that social influence significantly impacts responsible streaming behavior (β = 0,225, p < 0,05). This finding aligns with prior studies,(7,9,12) emphasizing that peer norms, group identity, and societal expectations play a critical role in shaping digital behaviors among Generation Z. Platforms like YouTube can affect social influence through peer recommendations, community engagement, and visibility of sustainable practices. However, findings from(13) highlight the variability of social influence, suggesting its impact might be weaker when individual preferences or content quality controls user decisions. Similarly, ease of use significantly correlates with responsible streaming behavior (β = 0,234, p < 0,05). This supports prior research(15,17) highlighting the importance of innate features such as easy navigation, accessibility, and options like lowering video quality in encouraging environmentally responsible behavior. Nevertheless, studies such as(18) suggest that habitual viewing patterns might limit the impact of ease-of-use features, indicating that platforms may need to pair usability with strategies targeting behavior change to maximize sustainability outcomes. On the other hand, awareness of sustainability does not show a statistically significant relationship with responsible streaming behavior (β = 0,138, p = 0,063). While awareness has been shown to influence behavior in other contexts,(20,21) the findings suggest it is insufficient. As noted by(22) platform-driven options to lower streaming resolutions or reminders for sustainable practices rather than reliance on awareness campaigns alone. The study also finds that trust in platform sustainability has no significant impact (β = 0,097, p = 0,211). This result contrasts research,(26,27) suggesting that trust can be crucial in shaping user engagement when tied to visible and actionable sustainability efforts. However, in established platforms like YouTube, users may already assume trust and focus more on functionality and content, reducing trust’s direct impact on sustainability behaviors. Finally, subscription convenience is not a significant driver of responsible streaming behavior (β = 0,086, p = 0,277). This is consistent with findings(29,30) showing that Generation Z users prioritize free or ad-supported content, making convenience factors like affordability and subscription flexibility less relevant in promoting sustainability behaviors. While convenience influences general satisfaction, its role in driving environmental responsibility appears limited. The study’s limitation is that it focuses only on YouTube, limiting understanding to responsible streaming on other platforms like Netflix or Spotify. Additionally, the sampling method was based on selecting participants who were easily accessible, which might not represent the entire Generation Z population. Future research could include multiple platforms and compare behaviors across different countries to better understand cultural and regional influences on sustainable streaming habits.
CONCLUSIONS
The study determines that responsible, sustainable behavior in streaming is affected by ease of use and social influence, emphasizing the importance of user-friendly features and societal norms in encouraging sustainable actions. While sustainability awareness has a positive but statistically insignificant effect, platforms must actively enhance sustainability campaigns to make a more significant impact. Trust and subscription convenience show limited influence, suggesting Generation Z trusts major platforms and focuses more on ease of use and content access. For Generation Z, free or ad-supported content makes subscription convenience less critical. To foster responsible streaming behaviors, platforms should highlight peer-driven strategies, such as community engagement and recommendations, and ensure easy navigation and accessibility. Transparent communication about sustainability efforts will build trust and motivate users to adopt sustainable habits. Moreover, addressing the social impacts of streaming, such as excessive screen time and algorithm-driven biases, through features like screen time reminders and inclusive content algorithms can ensure that streaming remains a socially beneficial and balanced activity.
BIBLIOGRAPHIC REFERENCES
1. Akidau T, Chernyak S, Lax R. Streaming systems: the what, where, when, and how of large-scale data processing. “ O’Reilly Media, Inc.”; 2018.
2. ITU DataHub. International Telecommunication Union. 2023. International Telecommunication Union, ITU DataHub, https://datahub.itu.int/. [Accessed on 15 Nov. 2024]. Available from: https://www.itu.int/itu-d/reports/statistics/2023/10/10/ff23-internet-use/
3. Feng W chi. Streaming media evolution: where to now? In: Proceedings of the 22nd international workshop on Network and Operating System Support for Digital Audio and Video. 2012. p. 57-8. https://doi.org/10.1145/2229087.2229103
4. Masanet E, Shehabi A, Lei N, Smith SJ, Koomey J. Recalibrating global data center energy-use estimates. Science (1979) [Internet]. 2020;367:984-6. Available from: https://api.semanticscholar.org/CorpusID:211554280 https://doi.org/10.1126/science.aba3758
5. Bonini T, Magaudda P. Streaming: Where It Comes From. In: Platformed! How Streaming, Algorithms and Artificial Intelligence are Shaping Music Cultures. Springer; 2023. p. 11-31. https://doi.org/10.1007/978-3-031-43965-0_2
6. Kamiya G, Bertoldi P. Energy consumption in data centres and broadband communication networks in the EU. European Commission, Joint Research Centre. 2024;
7. Wu T, Jiang N, Kumar TBJ, Chen M. The role of cognitive factors in consumers’ perceived value and subscription intention of video streaming platforms: a systematic literature review. Cogent Business & Management. 2024;11(1):2329247. https://doi.org/10.1080/23311975.2024.2329247
8. Borja K, Rodriguez S, Roby C. Streaming movies, series and shows: attitudes and beliefs among Gen Zers. Young Consumers. 2024; https://doi.org/10.1108/YC-04-2024-2057
9. Gong M, Bao X, Wagner C. Why viewers send paid gifts: The role of social influence on massively multiplayer online games live streaming. Inf Process Manag. 2023;60(4):103371. https://doi.org/10.1016/j.ipm.2023.103371
10. Shiu JY, Liao ST, Tzeng SY. How does online streaming reform e-commerce? An empirical assessment of immersive experience and social interaction in China. Humanit Soc Sci Commun. 2023;10(1):1-8. https://doi.org/10.1057/s41599-023-01731
11. Paschke K, Napp AK, Thomasius R. Parents rate problematic video streaming in adolescents: conceptualization and external assessment of a new clinical phenomenon based on the ICD-11 criteria of gaming disorder. J Clin Med. 2023;12(3):1010.https://doi.org/10.3390/jcm12031010
12. Zhang J, Gong X, Zhu Z, Zhang Z. Trust cost of environmental risk to government: the impact of Internet use. Environ Dev Sustain. 2023;25(6):5363-92.https://doi.org/10.1007/s10668-022-02270-1
13. Lee D, Wan C. The impact of mukbang live streaming commerce on consumers’ overconsumption behavior. Journal of Interactive Marketing. 2023;58(2-3):198-221. https://doi.org/10.1177/10949968231156104
14. Nowak R, Bennett A. Music consumption and technological eclecticism: investigating generation Y’s adoption and uses of music technologies. Young. 2020;28(4):347-62. https://doi.org/10.1177/1103308819896173
15. Wang S, Paulo Esperança J, Wu Q. Effects of live streaming proneness, engagement and intelligent recommendation on users’ purchase intention in short video community: take TikTok (DouYin) online courses as an example. Int J Hum Comput Interact. 2023;39(15):3071-83. https://doi.org/10.1080/10447318.2022.2091653
16. Habes M, Alghizzawi M, Ahmad AK, Almuhaisen O. The impact of digital media learning apps on students’ behaviors in distance learning during COVID-19 at the University of Jordan. Stud Media Commun. 2023;11(3):47-55. https://doi.org/10.11114/smc.v11i3.5982
17. Maziriri ET, Gapa P, Chuchu T. Student perceptions towards the use of YouTube as an educational tool for learning and tutorials. International Journal of Instruction. 2020;13(2):119-38. https://doi.org/10.29333/iji.2020.1329a
18. Warde A. Society and consumption. Consumption and Society. 2022;1(1):11-30. https://doi.org/10.1332/GTYE7193
19. Naidoo DT. Integrating TAM and IS success model: Exploring the role of Blockchain and AI in predicting learner engagement and performance in E-learning. Front Comput Sci. 2023;5:1227749. https://doi.org/10.3389/fcomp.2023.1227749
20. Horrich A, Ertz M, Bekir I. The effect of information adoption via social media on sustainable consumption intentions: The moderating influence of gender. Current Psychology. 2024;43(18):16349-62. https://doi.org/10.1007/s12144-023-05526-9
21. Suski P, Pohl J, Frick V. All you can stream: Investigating the role of user behavior for greenhouse gas intensity of video streaming. In: Proceedings of the 7th International Conference on ICT for Sustainability. 2020. p. 128-38. https://doi.org/10.1145/3401335.3401709
22. Khan K. Advancements in Sustainable Video Streaming: A Comprehensive Review on Enhancing Energy Efficiency in Adaptive Video Streaming Systems. International Journal of Multidisciplinary Research and Publications. 2024;6:202-7.
23. Ewim DRE, Ninduwezuor-Ehiobu N, Orikpete OF, Egbokhaebho BA, Fawole AA, Onunka C. Impact of data centers on climate change: a review of energy efficient strategies. The Journal of Engineering and Exact Sciences. 2023;9(6):16397-01e. https://doi.org/10.18540/jcecvl9iss6pp16397-01e
24. Masanet E, Shehabi A, Lei N, Smith S, Koomey J. Recalibrating global data center energy-use estimates. Science (1979). 2020;367(6481):984-6. https://doi.org/10.1126/science.aba3758
25. Pihkola H, Hongisto M, Apilo O, Lasanen M. Evaluating the energy consumption of mobile data transfer-from technology development to consumer behaviour and life cycle thinking. Sustainability. 2018;10(7):2494. https://doi.org/10.3390/su10072494
26. Bhalla S. Motivations and constraints of collaborative consumption, testing the mediating role of attitude and nature of trust. Vision. 2023;27(2):189-201. https://doi.org/10.1177/0972262921989127
27. Zhang J, Gong X, Zhu Z, Zhang Z. Trust cost of environmental risk to government: the impact of Internet use. Environ Dev Sustain. 2023;25(6):5363-92. https://doi.org/10.1007/s10668-022-02270-1
28. Huda M, Borham AH, Hashim A, Ritonga M, Almunawar MN, Anshari M, et al. Strategic role of trust in digital communication: critical insights into building organizational sustainability. In: Proceedings of the future technologies conference. Springer; 2023. p. 387-403. https://doi.org/10.1007/978-3-031-47457-6_25
29. Nagaraj S, Singh S, Yasa VR. Factors affecting consumers’ willingness to subscribe to over-the-top (OTT) video streaming services in India. Technol Soc. 2021;65:101534. https://doi.org/10.1016/j.techsoc.2021.101534
30. Mulla T. Assessing the factors influencing the adoption of over-the-top streaming platforms: A literature review from 2007 to 2021. Telematics and Informatics. 2022;69:101797. https://doi.org/10.1016/j.tele.2022.101797
31. Rovai AP, Baker JD, Ponton MK. Social science research design and statistics: A practitioner’s guide to research methods and IBM SPSS. Watertree Press LLC; 2013.
32. Field A. Comparing two means. Discovering statistics using IBM SPSS statistics fourth ed London: SAGE Publications Ltd. 2013;364-77.
33. Tavakol M, Dennick R. Making sense of Cronbach’s alpha. Int J Med Educ. 2011;2:53. https://doi.org/10.5116/ijme.4dfb.8dfd
34. Martínez-Líbano J, Yeomans-Cabrera M-M. Scale of Fear of Funa in Social Networks (FFSN): Construction and psychometric properties. Salud, Ciencia y Tecnología. 2024;4:1006.
35. PennState Eberly College of Science DMUVIFactorsA online: PennState Eberly College of Science, Detecting Multicollinearity Using Variance Inflation Factors. Available online: https://online.stat.psu.edu/stat462/node/180/ (Detecting Multicollinearity Using Variance Inflation Factors. [Accessed on 15 Nov. 2024]. Available from: https://online.stat.psu.edu/stat462/node/180/
FINANCING
The authors did not receive financing for the development of this research.
CONFLICT OF INTEREST
The authors declare that there is no conflict of interest.
AUTHORSHIP CONTRIBUTION
Conceptualization: Rashmi Mishra, Deepika Varshney, Fredrick Kayusi.
Research: Rashmi Mishra, Deepika Varshney, Fredrick Kayusi.
Methodology: Rashmi Mishra, Deepika Varshney, Fredrick Kayusi.
Drafting - original draft: Rashmi Mishra, Deepika Varshney, Fredrick Kayusi.
Writing - proofreading and editing: Rashmi Mishra, Deepika Varshney, Fredrick Kayusi.