Category: Finance, Business, Management, Economics and Accounting
ORIGINAL
University Management Information Systems: a Cross-cultural Study
Sistemas de información para la gestión universitaria: un estudio transcultural
Linnan Zhu1,2, Mohd Shahizan Bin Othman1, Lizawati Binti Mi Yusuf1, Xuying Sun3
1Faculty of Computing, Universiti Teknologi Malaysia. Johor Bahru, 81310, Malaysia.
2Modern Educational Technology Center, Cangzhou Normal University. Cangzhou 061000, Hebei, China.
3Academy of Music, Cangzhou Normal University. Cangzhou 061000, Hebei, China.
Cite as: Zhu L, Bin Othman MS, Mi Yusuf LB, Sun X. User Acceptance and Sustainable Adoption of University Management Information Systems: a Cross-cultural Study. Salud, Ciencia y Tecnología - Serie de Conferencias. 2024; 3:1167. https://doi.org/10.56294/sctconf20241167
Submitted: 23-02-2024 Revised: 13-05-2024 Accepted: 03-08-2024 Published: 04-08-2024
Editor:
Dr.
William Castillo-González ![]()
ABSTRACT
Management Information System (MIS) is an important support for the planning and management of information resources in universities. In different cultural backgrounds, users’ understanding and application of MIS may vary due to the language and cultural symbols they use, which can affect the actual application of the system. In order to improve the quality of management information in universities and understand different user needs, this article conducted a cross-cultural study on the user acceptance and sustainable adoption of MIS in universities. It constructed a theoretical research model using the Technology Acceptance Model (TAM), and then established system performance, management information quality, system interactivity, social impact, educational culture, usage habits, perceived usefulness, perceived ease of use, user acceptance, sustained use intention, and sustained use behavior as research variables. On this basis, a research hypothesis was constructed and finally validated through experimental analysis. The results show that system performance, management information quality, educational culture, and perceived usefulness had a significant positive impact on user acceptance, with path coefficients of 0,256, 0,752, 0,607, and 0,368, respectively. Social influence, usage habits, perceived usefulness, and user acceptance had a significant positive impact on user willingness to continue using, with path coefficients of 0,533, 0,532, 0,441, and 0,602, respectively. The conclusion indicates that cross-cultural research on user acceptance and sustainable adoption of MIS in universities can help understand user needs in different cultural backgrounds and provide objective guidance for improving the management level of universities.
Keywords: University Management Information System; Technology Acceptance Model; User Acceptance; Sustainable Adoption; Cross-Cultural Analysis.
RESUMEN
El sistema de información de gestión (MIS) es un importante apoyo para la planificación y gestión de los recursos de información en las universidades. En diferentes contextos culturales, la comprensión de los usuarios y la aplicación de MIS puede variar debido al idioma y los símbolos culturales que utilizan, lo que puede afectar la aplicación real del sistema. Con el objetivo de mejorar la calidad de la información de gestión en las universidades y entender las diferentes necesidades de los usuarios, en este artículo se realizó un estudio transcultural sobre la aceptación por parte de los usuarios y la adopción sostenible de sig en las universidades. Se construyó un modelo de investigación teórico utilizando el modelo de aceptación de la tecnología (TAM), y luego se estableció el rendimiento del sistema, la calidad de la información de gestión, la interactividad del sistema, el impacto social, la cultura educativa, los hábitos de uso, la utilidad percibida, la facilidad percibida de uso, la aceptación del usuario, la intención de uso sostenido y el comportamiento de uso sostenido como variables de investigación. Sobre esta base, se construyó una hipótesis de investigación que fue finalmente validada a través del análisis experimental. Los resultados muestran que el rendimiento del sistema, la calidad de la información de gestión, la cultura educativa y la utilidad percibida tuvieron un impacto positivo significativo en la aceptación del usuario, con coeficientes de trayectoria de 0,256, 0,752, 0,607 y 0,368, respectivamente. La influencia Social, los hábitos de uso, la utilidad percibida y la aceptación del usuario tuvieron un impacto positivo significativo en la voluntad del usuario para seguir usando, con coeficientes de camino de 0,533, 0,532, 0,441 y 0,602, respectivamente. La conclusión indica que la investigación intercultural sobre la aceptación de los usuarios y la adopción sostenible de los sistemas de información geográfica en las universidades puede ayudar a entender las necesidades de los usuarios en diferentes contextos culturales y proporcionar una guía objetiva para mejorar el nivel de gestión de las universidades.
Palabras clave: Sistema de Información de Gestión Universitaria; Modelo de Aceptación de la Tecnología; Aceptación del Usuario; Adopción Sostenible; Análisis Transcultural.
INTRODUCTION
With the maturity of big data technology and the acceleration of information technology, education and teaching management is gradually developing towards intelligence.(1,2) The role of MIS in supporting the daily operation and management of universities is becoming increasingly prominent. The diversity of cultural backgrounds among university groups and the differences in usage habits and needs among different users not only affect the actual effectiveness and user experience of the system, but also pose certain obstacles to the user acceptance and sustainable adoption of university MIS in cross-cultural contexts. In the actual use of MIS in universities, from a cross-cultural perspective, this study explores the acceptance and sustainable adoption of MIS by users in different cultural backgrounds, and reveals the mechanism of cultural differences in the implementation of MIS, providing scientific basis for further construction and optimization of MIS in universities. This has important theoretical and practical significance for improving the level of educational administrative management and promoting the modernization of education construction.
Under the goal of educational reform, the practice of informationization development in higher education teaching management is becoming increasingly important.(3) University MIS plays an important role in improving the efficiency of university management and optimizing resource allocation. With the maturity of Internet and digital technology, college MIS research has also achieved certain results. Enriquez, Fernando designed a business process management system based on RubricaSoft that focuses on dynamic educational processes, automating multiple tasks such as information integration and deadline management. Finally, from the experimental evaluation results, it can be seen that the proposed management system can effectively improve teacher productivity and improve student participation.(4) Chu Qingdong analyzed the requirements for a university student information management system and built a student information management system based on Java language and SQL (Structured Query Language) Server database. Finally, he conducted performance testing on the system, and the test results showed that the system ran well, could achieve the predetermined functions, and meet the needs of university student information management.(5) Based on the needs of information technology development, Wang Dingke designed and improved the construction of a smart campus according to the current situation, and proposed a smart campus management system for universities. He divided the system architecture into the basic layer and the application layer, achieving the integration of network resources and data resources, and serving teaching management. Finally, he demonstrated through practical application that the proposed system can effectively improve teaching quality and promote the overall strength of the college.(6) To determine the impact of MIS on universities, Bright, Antwi Amankwah evaluated the adequacy of existing MIS and its utilization in student learning and teacher teaching in universities. Through questionnaire surveys and collecting information from respondents, it was found that current universities need to effectively connect MIS with practical work to enhance its use and benefit all stakeholders.(7) Valks Bart proposed the application of the Internet of Things in university management information, and identified the process level requirements for making strategic decisions in university management information through four case studies. He also demonstrated how the information of the Internet of Things can be directly connected to these processes. He ultimately proved through practice that the Internet of Things can improve the efficiency and shared space of information resources in universities.(8) With the continuous advancement and application of technology, current university MIS has been continuously improved and developed. However, most systems still have limitations in user experience and have not conducted in-depth investigation and analysis on user acceptance and sustainable adoption.
Understanding user acceptance and sustainable adoption of university MIS can help adjust to user needs and improve system utilization. Malaya, Ara Rivina N adopted descriptive development research design and rapid application development model to develop a university information management system. He conducted a survey on the acceptability of faculty and administrative staff through a questionnaire. The overall results indicate that the system has high acceptability in terms of functional applicability, reliability, and other aspects.(9) Garone, Anja used the Unified Theory of Technology Acceptance and Use to investigate the acceptance of learning management systems among university faculty and staff. He generated three different groups through cluster analysis using technology acceptance and unified theory predictive variables as input variables: high, medium, and low score clusters. He reflected the differences between clusters in the acceptance of different groups of faculty and staff in the learning management system, providing decision-making and guidance for formulating institutional professional development measures tailored to the needs of specific university faculty and staff groups.(10) Saroia, Asher Irfan developed a research model based on technology acceptance to explore the willingness of Swedish higher education students to adopt mobile learning management systems. He finally empirically tested the proposed research model and hypothesis among 130 Swedish university students. According to the research results, the proposed method moderately predicted the willingness of student groups to accept mobile learning management systems.(11) By conducting in-depth research on user acceptance and sustainable adoption, the design and functionality of the system can be continuously improved and optimized. However, current research lacks a comprehensive consideration of the differences in user system usage needs across different cultural backgrounds.
In order to improve the application effect of MIS in universities and enhance the quality of education and teaching management, this article conducts cross-cultural research on the user acceptance and sustainable adoption of MIS in universities. A theoretical model was constructed based on TAM, which established 11 research variables and 12 research hypotheses. It takes a certain university’s MIS as the object, with undergraduate students and faculty as the sample subjects, and conducts experimental analysis from two perspectives: reliability and validity analysis, and model validation. In the reliability and validity analysis, the Cronbach’s Alpha values of each variable are all greater than 0,7; the KMO values are all greater than 0,5, and the significance of Bartlett’s sphericity test is less than 0,001; in model validation, all hypotheses except for H3, H9, and H10 are valid. The P-values of H3, H9, and H10 are 0,582, 0,271, and 0,507, respectively, all greater than 0,05. The T-values are 0,712, 0,511, and 0,963, all less than 1,96. In practical applications, improving system performance, management information quality, educational culture, and other aspects can help enhance the level and effectiveness of management information.
Acceptance and sustainable adoption of mis users in universities from a cross-cultural perspective
Research Model
TAM is a theoretical model used to explain and predict individual adoption of new technologies.(12,13) This model is based on the theory of rational behavior, which believes that the usage of information systems depends on the user’s willingness to use the information system, and the user’s willingness to use the information system depends on their own usage attitude.(14) This association implies that the user’s behavioral intention during the use of the information system is formed based on their positive attitude.
Perceived usefulness and perceived ease of use are two variable concepts proposed in this theoretical model.(15) Perceived usefulness refers to the degree to which users feel that a technology or system improves their own efficiency when using it. Perceived ease of use refers to the degree to which users feel that a technology or system is easy to use. TAM provides an important theoretical basis and methodological support for in-depth analysis of the mechanism by which external factors affect internal beliefs, and can effectively explain and predict the degree of user acceptance of information systems.(16,17) Based on exploring the basis of user acceptance and rejection of information systems, TAM elucidates the relationship between belief factors and user attitudes, intentions, and usage behaviors. This is a representative theoretical model for studying user adoption in information systems.
In the analysis of user acceptance and sustainable adoption of MIS in universities, this article is supported by the TAM theoretical model. While retaining the two key variables of perceived usefulness and perceived ease of use in the original model, relevant variables such as social impact, educational culture, and usage habits are introduced. It comprehensively considers the characteristics of university MIS and combines existing research ideas to construct a conceptual model for user acceptance and sustainable adoption of university MIS, as shown in figure 1.
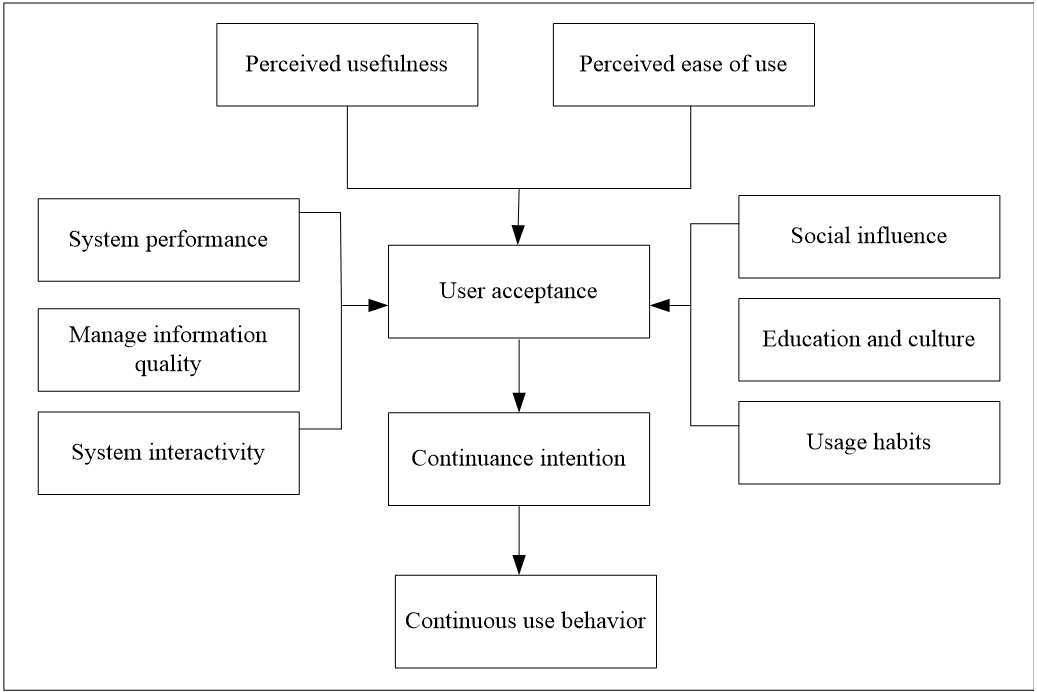
Figure 1. Conceptual model of acceptance and sustainable adoption of MIS users in universities
From figure 1, this article establishes the conceptual model as 11 variables: system performance, management information quality, system interactivity, social influence, education and culture, usage habits, perceived usefulness, perceived ease of use, user acceptance, continuance intention, and continuous use behavior.
METHOD
Definition and Measurement of Research Variables
System performance variables
System performance refers to the user’s experience and perception of various performance aspects of MIS, such as efficiency, functional completeness, security, and stability. The efficiency of university MIS is reflected in the system’s fast and efficient response to user requests. Functional completeness refers to the completeness of the functions and services provided by the system, which can meet the needs and goals of users. Security refers to the ability of MIS to effectively protect the security of relevant management data and user personal information. Stability refers to the ability of the system to support users to enter the system at anytime and anywhere, and to ensure the normal progress of their requested tasks. The measurement dimensions are shown in table 1:
|
Table 1. Measurement of system performance variables |
||
|
Variable |
Number |
Dimension |
|
System performance (P) |
P1 |
When using MIS, I can quickly find the necessary features or information. |
|
P2 |
When using MIS, the system covers all the functions I need to use in management. |
|
|
P3 |
When using MIS, I feel that my information security is fully guaranteed. |
|
|
P4 |
When using MIS, there are rarely crashes or inaccessible situations, and I can confidently rely on the system for daily management work. |
|
Management information quality variables
The quality of management information is not only related to the task execution efficiency of university administrators, teachers, and students, but also to the decision-making quality of the school. The quality standards for management information can be specifically divided into three aspects: accuracy, completeness, and timeliness. Among them, accuracy refers to the information provided in MIS being accurate and realistic. Only by ensuring the authenticity and accuracy of management information can people better guide school decision-making and ensure the normal operation and management of the school. Integrity refers to the ability of MIS to provide comprehensive information that covers various aspects of school management needs. The absence or incompleteness of key information can have an impact on the judgment and decision-making of decision-makers. Timeliness refers to the timely reflection of the current status and development of school management by the management information of the system. In the process of user use, it is necessary to achieve timely updates of data information in order to better meet user requirements for information management. The measurement dimensions are shown in table 2:
|
Table 2. Measurement of management information quality variables |
||
|
Variable |
Number |
Dimension |
|
Manage information quality (Q) |
Q1 |
I have a high level of trust in the data quality provided by MIS, which can truly reflect the situation and data of various aspects of universities. |
|
Q2 |
I am very satisfied with the completeness of the information provided by MIS, which can meet my needs. |
|
|
Q3 |
I am satisfied with the timely information provided by MIS, which can meet my needs for instant feedback. |
|
System interactivity variables
System interactivity refers to the process, methods, and quality of user system interaction.(18) This variable mainly explores the user’s interactive experience in MIS, including the process of executing operations and receiving feedback between the user and MIS. The measurement dimensions are shown in table 3:
|
Table 3. Measurement of system interactivity variables |
||
|
Variable |
Number |
Dimension |
|
System interactivity (I) |
I1 |
When using MIS, I can interact effectively with the system. |
|
I2 |
MIS provides multiple interaction methods to meet my interaction needs. |
|
|
I3 |
I think using MIS for interaction is a pleasant experience. |
|
Social impact variables
Social influence refers to the impact of an individual’s situation on their cognitive beliefs and behavioral attitudes.(19,20) In the analysis of MIS user acceptance and sustainable adoption, social influence specifically refers to the influence of others on the user’s cognitive concepts and behavioral attitudes towards MIS. The measurement dimensions are shown in table 4:
|
Table 4. Measurement of social impact variables |
||
|
Variable |
Number |
Dimension |
|
Social influence (S) |
S1 |
I believe that using MIS has a positive impact on my career or academic development. |
|
S2 |
I think using MIS has enhanced my social network. |
|
|
S3 |
The use of MIS by my colleagues or classmates has an impact on my attitude towards using it. |
|
Educational and cultural variables
Educational culture is the overall atmosphere of a country or region’s educational traditions, values, systems, and educational styles. The measurement dimensions are shown in table 5:
|
Table 5. Measurement of educational and cultural variables |
||
|
Variable |
Number |
Dimension |
|
Education and culture (C) |
C1 |
I think the design and functionality of MIS are in line with my educational and cultural background. |
|
C2 |
When using MIS, I can choose to use a language and interface style that I am familiar with to better integrate into the system usage environment. |
|
|
C3 |
I believe that the design philosophy and values of MIS are in line with the cultural characteristics of my school or educational institution. |
|
Using habit variables
Usage habits are a fixed behavior pattern with personal characteristics formed by users in their daily work and life processes regarding the use of MIS. These behavioral patterns are often related to the habitual behavioral styles that users retain in their daily learning or work. The measurement dimensions are shown in table 6:
|
Table 6. Using habitual variables for measurement |
||
|
Variable |
Number |
Dimension |
|
Usage habits (M) |
M1 |
I have become accustomed to using MIS for daily management work and am very familiar with the various functions and operating procedures of the system. |
|
M2 |
When using MIS, I can customize the interface according to personal preferences and habits, which improves the comfort and efficiency of use. |
|
|
M3 |
I am accustomed to constantly learning new features and updating content of the system, and trying to apply them to practical work. |
|
Perceived usefulness variables
Perceived usefulness is a key variable in TAM theory.(21,22) When users feel that the functions and services provided by the MIS system are helpful in achieving their work objectives and results during the application process, it is called perceived usefulness. The measurement dimensions are shown in table 7:
|
Table 7. Measurement of perceived usefulness variables |
||
|
Variable |
Number |
Dimension |
|
Perceived usefulness (U) |
U1 |
After using MIS, I was able to complete various management tasks more efficiently, which improved my efficiency and output. |
|
U2 |
When using MIS, I am able to obtain accurate management information, which helps me make effective decisions and plans. |
|
|
U3 |
When using MIS, I am able to receive timely technical support and assistance, which effectively solves problems and doubts. |
|
Perceived ease of use
The so-called perceived ease of use refers to the subjective feeling and evaluation that users have of the convenience of using MIS in their daily use. In TAM theory, perceived ease of use reflects the degree to which users perceive whether the system’s learning, usage, and operation are simple.(23,24) The measurement dimensions are shown in table 8:
|
Table 8. Measurement of perceived usability variables |
||
|
Variable |
Number |
Dimension |
|
Perceived ease of use (E) |
E1 |
I think the interface design of the system is concise and clear, easy to understand and operate. |
|
E2 |
I think the operational process for completing tasks in the system is reasonable, without redundant steps or cumbersome operations. |
|
|
E3 |
When using MIS, the system can provide clear operational feedback and prompts in a timely manner, allowing me to have a clear understanding of the current operational status. |
|
User acceptance variable
User acceptance refers to the ability of users to accept MIS in their studies or work. Acceptance is a quantitative description of this level of acceptance. The measurement dimensions are shown in table 9:
|
Table 9. Measurement of user acceptance variables |
||
|
Variable |
Number |
Dimension |
|
User acceptance (A) |
A1 |
The decision to use MIS is wise. |
|
A2 |
The process of using MIS is interesting. |
|
|
A3 |
I am satisfied with using MIS to complete various management tasks. |
|
Continuous use of willingness variables
The willingness to continue using university MIS refers to the ability of users to continue using it in the long run, which belongs to the user’s attitude towards MIS. The measurement dimensions are shown in table 10:
|
Table 10. Measurement of continuous use intention variables |
||
|
Variable |
Number |
Dimension |
|
Continuance intention (V) |
V1 |
I am willing to use MIS |
|
V2 |
I will continue to use MIS in the future |
|
|
V3 |
I am willing to recommend MIS to my classmates around me |
|
Continuous use of behavioral variables
Continuous use behavior refers to the actual use of a system by users over a certain period of time.(25,26) It belongs to the user’s behavior towards MIS. The measurement dimensions are shown in table 11:
|
Table 11. Measurement of continuous use behavior variables |
||
|
Variable |
Number |
Dimension |
|
Continuous use behavior (B) |
B1 |
I have been using MIS continuously for a period of time and there is no sign of giving up or reducing usage. |
|
B2 |
I actively participate in the improvement and feedback of MIS, often providing suggestions or opinions to help the system better meet my needs. |
|
|
B3 |
When dealing with urgent or important matters, I first consider using MIS to complete the task, rather than looking for alternative solutions. |
|
Research Hypotheses
Based on the variables established in the conceptual model, 12 research hypotheses can be established:
System performance assumptions
The performance of MIS has a significant impact on its practical application. A university MIS with good performance can ensure that users can efficiently and quickly complete management information work, save their time and energy, and thus generate good user acceptance. Therefore, the hypothesis is proposed:
H1: system performance has a positive impact on user acceptance
Assumption of Management Information Quality
The improvement of management information quality can better meet the needs of users and increase their acceptance of the system. When users feel that the management information services provided by the system are of high quality and can satisfy them, their acceptance can also increase. Therefore, the hypothesis is proposed:
H2: the quality of management information has a positive impact on user acceptance.
System Interactivity Hypothesis
When users need to successfully satisfy their interactions in MIS and be able to operate and receive feedback more easily, they can be more willing to accept MIS. On the contrary, if there is a lack of interactivity, it can affect the user’s acceptance level. Based on this, a hypothesis is proposed:
H3: system interactivity has a positive impact on user acceptance.
Social Impact Hypothesis
The fundamental reason for social influence lies in social norms. The values formed by social norms can directly affect the attitudes and behaviors of users towards MIS. Under the influence of surrounding objects, the greater the social impact, the stronger the user’s willingness to use MIS. Therefore, the hypothesis is proposed:
H4: social influence has a positive impact on users’ willingness to continue using.
Educational and cultural assumptions
In different cultural backgrounds, there are differences in educational ideas, teaching methods, and other aspects among countries or regions, which can have a certain impact on the design and application of MIS. If a country or region values self-learning and information technology education, users can have a higher acceptance of MIS. Therefore, the hypothesis is proposed:
H5: educational culture has a positive impact on user acceptance.
Use Habit Hypothesis
The influence of habits is mainly manifested in transforming the user’s intention into non reactive behavior.(27) The stronger the user’s spontaneous tendency towards a specific behavior, the more frequent and repetitive it is. In real life, habitual behavior often occurs faster and more effectively than non habitual behavior. If a habit is of great intensity, it can transcend the influence of action intention and have a direct impact on action. Therefore, the hypothesis is proposed:
H6: usage habits have a positive impact on users’ willing//ness to continue using.
Perceived usefulness hypothesis
At the level of satisfying needs and motivation, the greater the utility of the user’s perception system, the higher the user’s acceptance, and the stronger the user’s willingness to continue using.(28) On the contrary, when users use MIS, the lower their perceived usefulness, the lower their acceptance of MIS, which in turn affects their willingness to continue using MIS. Therefore, the hypothesis is proposed:
H7: perceived usefulness has a positive impact on user acceptance.
H8: perceived usefulness has a positive impact on users’ willingness to continue using it.
Perceived Usability Hypothesis
Network technology is developing on a huge scale and at a rapid pace. For university MIS, in terms of managing information, users usually choose MIS with more reasonable and smooth operating procedures, simpler and more intuitive interfaces, and more reasonable learning costs. Because user-friendly operating procedures, interface design, and learning costs are more easily attracted to people from different cultural backgrounds, it increases user acceptance and willingness to continue using the system. Therefore, the hypothesis is proposed:
H9: perceived ease of use has a positive impact on user acceptance;
H10: perceived ease of use has a positive impact on users’ willingness to continue using it;
Assumption of user acceptance
User acceptance is an important factor affecting their willingness to continue using MIS. The higher the user’s acceptance of MIS, the higher their willingness to continue using it; On the contrary, if users cannot adapt well to this system, they can stop using or switch to other systems. Therefore, the hypothesis is proposed:
H11: user acceptance has a positive impact on the willingness to continue using.
Assumption of continued willingness to use
Continuous willingness to use can motivate users to maintain a continuous system usage behavior.(29,30) Even if faced with difficulties and changes in the short term, users with strong needs can continue to use this system. Based on this, a hypothesis is proposed:
H12: the willingness to continue using has a positive impact on continuous use behavior.
Experiment of user acceptance and sustainable adoption
To verify the research hypothesis of user acceptance and sustainable adoption of MIS in universities, this article conducted experimental analysis through a questionnaire survey. In the experimental analysis, this article takes MIS of a certain university as the object, and undergraduate students and faculty of the university as the sample subjects. The survey questionnaire is divided into two parts. The first part mainly introduces the basic information of the sample subjects, including their gender, age, social status, language and cultural background, frequency and time of using MIS. The second part can use a Likert five point scale design to examine 11 variables of university MIS, including system performance, management information quality, system interactivity, social impact, educational culture, usage habits, perceived usefulness, perceived ease of use, user acceptance, sustained use intention, and sustained use behavior. The variable measurement dimensions in tables 1 to 11 can be used to form a questionnaire. The answers to each question are divided into 5 levels: strongly disagree, disagree, neutral, agree, and strongly agree. The corresponding scores for each level are 1-5 points. A total of 126 questionnaires were collected in this survey, of which 108 were valid.
RESULTS
Sample Description
In this questionnaire survey, the basic information of the sample subjects is shown in table 12:
|
Table 12. Sample subject information |
|||
|
Item |
Classification |
Number of people |
Proportion (%) |
|
Gender |
Male |
58 |
53,70 |
|
Female |
50 |
46,30 |
|
|
Age |
18-21 years old |
52 |
48,15 |
|
22-27 years old |
26 |
24,07 |
|
|
Over 27 years old |
30 |
27,78 |
|
|
Social status |
Undergraduate students |
72 |
66,67 |
|
Faculty and staff |
36 |
33,33 |
|
|
Language and cultural background |
Chinese native speakers |
77 |
71,30 |
|
English native speaker |
29 |
26,85 |
|
|
other |
2 |
1,85 |
|
|
The frequency of using university MIS every week |
Less than 3 times |
31 |
28,70 |
|
3 or more times |
77 |
71,30 |
|
|
Duration of each use |
Less than 1 hour |
45 |
41,67 |
|
1 hour or more |
63 |
58,33 |
|
From table 12, it can be seen that the gender distribution of the samples in this survey is relatively uniform, with male and female gender samples accounting for 53,70 % and 46,30 % respectively, indicating the universality of the samples in this study. From the perspective of age distribution, the sample size between the ages of 18 and 21 is relatively large, reaching 48,15 %. In terms of social status distribution, the proportion of undergraduate students and faculty members is 66,67 % and 33,33 %, respectively; in the distribution of language and cultural backgrounds, the proportion of Chinese native speakers reaches 71,30 %, while the proportion of English native speakers and other samples is 26,85 % and 1,85 %, indicating that the sample subjects have different cultural backgrounds; from the frequency and duration distribution of using MIS in universities, 71,30 % of the survey samples used it three times or more, and 58,33 % used it for one hour or more each time. From this specific distribution, it can be seen that the majority of respondents frequently use university MIS and have a certain understanding of it.
Reliability and Validity Testing
Reliability test
In the reliability test, this article uses SPSS (Statistical Product and Service Solutions) 21.0 software to analyze the questionnaire scale. The Cronbach’s Alpha reliability coefficient standard can be used to determine the reliability of the measurement results of various variables in the college MIS user acceptance and sustainable adoption questionnaire. The final results are shown in table 13:
|
Table 13. Reliability test results |
||
|
Variable |
Measurement dimension number |
Cronbach’s Alpha value |
|
P |
P1 |
0,802 |
|
P2 |
||
|
P3 |
||
|
P4 |
||
|
Q |
Q1 |
0,776 |
|
Q2 |
||
|
Q3 |
||
|
I |
I1 |
0,753 |
|
I2 |
||
|
I3 |
||
|
S |
S1 |
0,775 |
|
S2 |
||
|
S3 |
||
|
C |
C1 |
0,841 |
|
C2 |
||
|
C3 |
||
|
M |
M1 |
0,836 |
|
M2 |
||
|
M3 |
||
|
U |
U1 |
0,795 |
|
U2 |
||
|
U3 |
||
|
E |
E1 |
0,793 |
|
E2 |
||
|
E3 |
||
|
A |
A1 |
0,789 |
|
A2 |
||
|
A3 |
||
|
V |
V1 |
0,864 |
|
V2 |
||
|
V3 |
||
|
B |
B1 |
0,837 |
|
B2 |
||
|
B3 |
||
Generally speaking, when Cronbach’s Alpha is greater than 0,7, it indicates that the measurement results of each variable in the questionnaire have good consistency. From the results in table 13, it can be seen that the Cronbach’s Alpha values of all variables in the questionnaire are greater than 0,7. This indicates that the measurement results of each variable in this questionnaire remain within a high level of reliability and have good consistency.
Validity testing
In the validity test, SPSS 21.0 software was also used to analyze the questionnaire scale, and KMO (Kaiser-Meyer-Olkin) test and Bartlett sphericity test were used. The results are shown in table 14:
|
Table 14. KMO test and Bartlett sphericity test results |
||
|
Variable |
KMO value |
Significance of Bartlett’s sphericity test |
|
P |
0,583 |
0,000 |
|
Q |
0,607 |
0,000 |
|
I |
0,663 |
0,000 |
|
S |
0,579 |
0,000 |
|
C |
0,605 |
0,000 |
|
M |
0,723 |
0,000 |
|
U |
0,636 |
0,000 |
|
E |
0,559 |
0,000 |
|
A |
0,538 |
0,000 |
|
V |
0,621 |
0,000 |
|
B |
0,635 |
0,000 |
From table 14, it can be seen that the KMO values of each variable in the questionnaire are all greater than 0,5, and the significance of Bartlett’s sphericity test is less than 0,001. This indicates that its validity is feasible and suitable for factor analysis.
On this basis, aggregate validity analysis and discriminant validity analysis were performed on each variable, as shown in figure 2 and table 15:
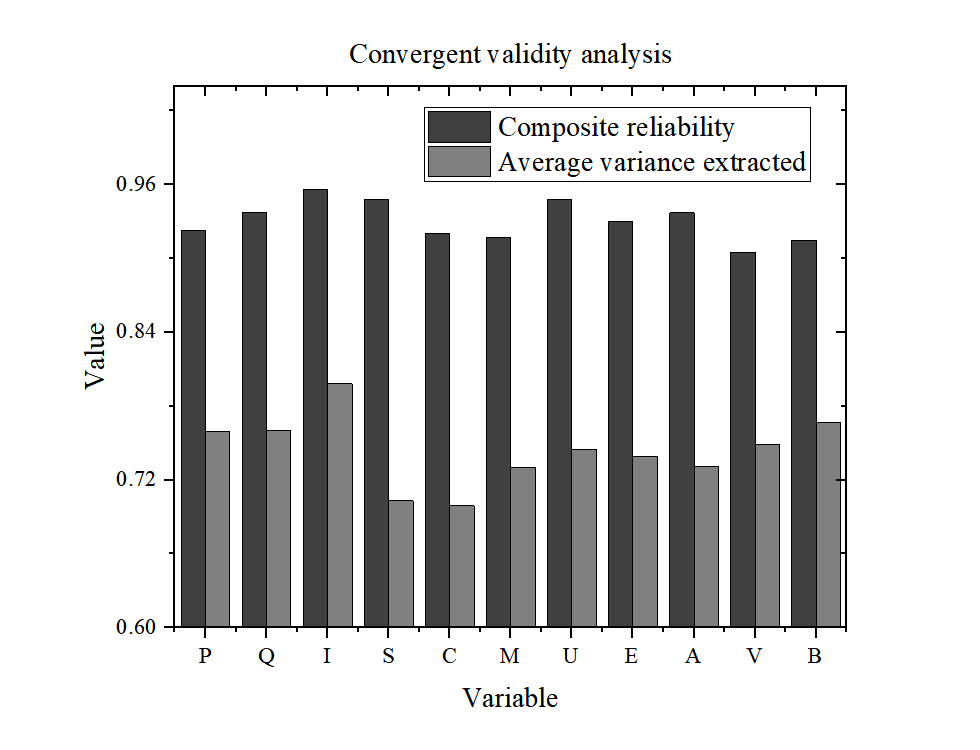
Figure 2. Aggregation validity analysis results
In figure 2, the Composite Reliability (CR) value is used to test the consistency between variables at the scale. The Average Variance Extracted (AVE) value is used to quantify the interpretability of each variable for the measure it measures. From the aggregated validity analysis results, it can be seen that the CR value of the scale in this article is greater than 0,7, and its specific range is between 0,900 and 0,960. The AVE value is greater than 0,5, and its specific range is between 0,690 and 0,800. This indicates that the scale has high intrinsic consistency and good structural validity.
|
Table 15. Discriminant validity analysis |
|||||||||||
|
Variable |
P |
Q |
I |
S |
C |
M |
U |
E |
A |
V |
B |
|
P |
0,802 |
|
|
|
|
|
|
|
|
|
|
|
Q |
0,672 |
0,913 |
|
|
|
|
|
|
|
|
|
|
I |
0,732 |
0,673 |
0,876 |
|
|
|
|
|
|
|
|
|
S |
0,696 |
0,642 |
0,581 |
0,818 |
|
|
|
|
|
|
|
|
C |
0,757 |
0,622 |
0,749 |
0,692 |
0,823 |
|
|
|
|
|
|
|
M |
0,704 |
0,734 |
0,575 |
0,577 |
0,698 |
0,895 |
|
|
|
|
|
|
U |
0,684 |
0,566 |
0,641 |
0,637 |
0,682 |
0,597 |
0,906 |
|
|
|
|
|
E |
0,571 |
0,735 |
0,574 |
0,721 |
0,717 |
0,742 |
0,725 |
0,844 |
|
|
|
|
A |
0,767 |
0,578 |
0,627 |
0,675 |
0,626 |
0,666 |
0,754 |
0,578 |
0,871 |
|
|
|
V |
0,754 |
0,565 |
0,583 |
0,712 |
0,701 |
0,712 |
0,603 |
0,677 |
0,625 |
0,835 |
|
|
B |
0,733 |
0,676 |
0,686 |
0,737 |
0,743 |
0,576 |
0,75 |
0,592 |
0,691 |
0,734 |
0,813 |
|
Note: the diagonal in the center of the table is the square root value of AVE; other are correlation coefficients |
|||||||||||
According to the discriminant validity analysis results in table 15, the square root values of AVE are all greater than the correlation coefficients, indicating that the accuracy and reliability of the scale are relatively ideal.
Model Validation
On the basis of reliability and validity analysis of the scale, this paper uses structural equation modeling to validate the theoretical model and verifies the research hypothesis through path coefficients. The final results are shown in table 16:
|
Table 16. Model validation results |
|||||
|
Research hypothesis sequence |
Path |
Path coefficient |
T value |
P value |
Result valid or Invalid |
|
H1 |
P-A |
0,256 |
3,352 |
0,023 |
Valid |
|
H2 |
Q-A |
0,752 |
2,014 |
0,036 |
Valid |
|
H3 |
I-A |
0,089 |
0,712 |
0,582 |
Invalid |
|
H4 |
S-V |
0,533 |
7,458 |
0,011 |
Valid |
|
H5 |
C-A |
0,607 |
5,147 |
0,001 |
Valid |
|
H6 |
M-V |
0,532 |
2,339 |
0,009 |
Valid |
|
H7 |
U-A |
0,368 |
5,185 |
0,015 |
Valid |
|
H8 |
U-V |
0,441 |
4,352 |
0,015 |
Valid |
|
H9 |
E-A |
0,075 |
0,511 |
0,271 |
Invalid |
|
H10 |
E-V |
0,093 |
0,963 |
0,507 |
Invalid |
|
H11 |
A-V |
0,602 |
2,785 |
0,041 |
Valid |
|
H12 |
V-B |
0,613 |
4,031 |
0,025 |
Valid |
From table 16, it can be seen that there are three research hypotheses that are not valid in model validation, namely H3, H9, and H10. Their P values are 0,582, 0,271, and 0,507, all greater than 0,05, and their T values are 0,712, 0,511, and 0,963, all less than 1,96. This indicates that system interactivity does not have a significant impact on user acceptance, and perceived ease of use does not have a significant positive impact on user acceptance and willingness to continue using. All other research hypotheses are valid.
DISCUSSION
In the experimental analysis of user acceptance and sustainable adoption, this article validates the research hypothesis. Among them, except for three research hypotheses that are not valid, most of the research hypotheses are valid, which can be roughly classified as:
System performance, management information quality, educational culture, and perceived usefulness have a significant positive impact on user acceptance
The path coefficients of system performance, management information quality, educational culture, and perceived usefulness on user acceptance are 0,256, 0,752, 0,607, and 0,368, respectively. In a cross-cultural context, for both Chinese and English native speakers, the system performance and management information quality of university MIS have a direct impact on the efficiency of teacher work and student learning task completion. In cross-cultural communication, the educational and cultural atmosphere is more open and favorable, which is more conducive to improving users’ acceptance of MIS. In actual use, users feel the practical value and positive impact brought by MIS, thereby improving their acceptance of MIS.
System interactivity does not have a significant positive impact on user acceptance
The actual use of MIS in universities is mostly demand driven, and current MIS systems all support multilingual conversion. System interactivity can meet the basic needs of different native speakers, and most users adopt the system to complete corresponding tasks. Further improving interactivity can not significantly enhance user acceptance.
Social influence, usage habits, perceived usefulness, and user acceptance have a significant positive impact on user willingness to continue using
The path coefficients of social influence, usage habits, perceived usefulness, and user acceptance on user’s willingness to continue using are 0,533, 0,532, 0,441, and 0,602, respectively; for students and faculty from different cultural backgrounds, the cognition and attitude of surrounding people towards MIS can have an impact on their willingness to continue using it. Users from different cultural backgrounds have different usage habits. When they perceive the functionality and value of the system and have a high level of acceptance, they are more inclined to continue using the system.
Perceived ease of use has no positive impact on user acceptance and willingness to continue using
There is a significant difference between university MIS and ordinary business systems, as it is an application system with mandatory and low compensatory capabilities. For users from different cultural backgrounds, regardless of the ease of use of the system, only when there is a need for use can it continue to be used. Therefore, perceived ease of use has no direct impact on user acceptance and willingness to continue using.
Continuous use intention has a positive impact on continuous use behavior
For Chinese native speakers, English native speakers, and users of other languages, a sustained willingness to use may encourage users to form usage habits. Once they develop a habit of using MIS continuously, they may continue to use it even when facing some difficulties or choices.
CONCLUSIONS
With the development of intelligent education, the role and status of university MIS in education and teaching management are becoming increasingly important. In different cultural backgrounds, an important way for the healthy development of education and teaching management is to meet the needs of different users, improve the acceptance and continuous adoption of MIS users. In order to understand the usage of MIS by different user entities and improve the effectiveness of MIS applications, this article conducted a cross-cultural study on the user acceptance and sustainable adoption of MIS in universities. Among them, the performance, information quality, educational culture, and perceived usefulness of university MIS have a significant positive impact on user acceptance. Social influence, usage habits, perceived usefulness, and user acceptance have a significant positive impact on user willingness to continue using. This result not only provides a deep understanding of the characteristics and influencing factors of user behavior in different cultural backgrounds, but also provides effective basis for MIS improvement. This study also has corresponding limitations. In future research, the paper can consider exploring the sustainable adoption of MIS in universities from other perspectives, in order to provide more theoretical support and practical experience for improving management efficiency and service quality in universities.
BIBLIOGRAPHIC REFERENCE
1. Wang Diaojiang. “Innovative thinking on informatization of education management in colleges and universities in the context of big data.”Research and practice of Innovation and Entrepreneurship Theory 4.22 (2021): 154-156.
2. Shao Yan. “Exploring the informatization model of smart campus in colleges and universities in the big data environment.”Journal of Jilin University (Information Science Edition) 38.4 (2020): 502-508. DOI: 10.3969/j.issn.1671-5896.2020.04.018
3. Lin Yuan, and Chen Long. “Practice and thinking on the informatization construction of teaching in colleges and universities.” Research & Exploration in Laboratory 38.8 (2019): 236-239. DOI:CNKI:SUN:SYSY.0.2019-08-056.
4. Enriquez, Fernando, Jose A. Troyano, and Luisa M. Romero-Moreno. “Using a business process management system to model dynamic teaching methods.” The Journal of Strategic Information Systems 28.3 (2019): 275-291. DOI: 10.1016/j.jsis.2018.07.002
5. Chu Qingdong, Zhang Minxia, and Cui Weitao. “The design and implementation of a new type of student information management system in colleges and universities.”Information Technology 43.6 (2019): 69-71. DOI: CNKI:SUN:HDZJ.0.2019-06-017
6. Wang Dingke. “Research on the design of smart campus management system in colleges and universities.”Modern information technology 4.1 (2020): 69-70. DOI: CNKI:SUN:XDXK.0.2020-01-026
7. Bright, Antwi Amankwah, and Gideon Asare. “The impact of management information system on University of Education Winneba, Kumasi Campus-Ghana.” European Journal of Research and Reflection in Management Sciences 7.1 (2019): 1-20.
8. Valks, Bart, Monique H. Arkesteijn, Alexander Koutamanis &Alexandra C. den Heijer. “Towards a smart campus: supporting campus decisions with Internet of Things applications.” Building Research & Information 49.1 (2021): 1-20. DOI: 10.1080/09613218.2020.1784702
9. Malaya, Ara Rivina N., Emely A. Munar, Floribeth Panay Cuison, Enrico G. Dacanay. “Information management system for research of Don Mariano Marcos Memorial State University–South La Union Campus.” Indonesian Journal of Electrical Engineering and Computer Science 28.3 (2022): 1668-1675.
10. Garone, Anja, Bram Pynoo, Jo Tondeur, Celine Cocquyt, Silke Vanslambrouck, Bram Bruggeman, et al. “Clustering university teaching staff through UTAUT: Implications for the acceptance of a new learning management system.” British Journal of Educational Technology 50.5 (2019): 2466-2483. DOI: 10.1111/bjet.12867
11. Saroia, Asher Irfan, and Shang Gao. “Investigating university students’ intention to use mobile learning management systems in Sweden.” Innovations in Education and Teaching International 56.5 (2019): 569-580. DOI: 10.1080/14703297.2018.1557068
12. Aburbeian, AlsharifHasan Mohamad, Amani Yousef Owda, and Majdi Owda. “A technology acceptance model survey of the metaverse prospects.” Ai 3.2 (2022): 285-302. DOI: 10.3390/ai3020018
13. Park, Eun Soo, and Min Seo Park. “Factors of the technology acceptance model for construction IT.” Applied Sciences 10.22 (2020): 8299-8313. DOI:10.3390/app10228299
14. Granic, Andrina, and Nikola Marangunic. “Technology acceptance model in educational context: A systematic literature review.” British Journal of Educational Technology 50.5 (2019): 2572-2593. DOI: 10.1111/bjet.12864
15. Fan Zhe, and Liu Yilun. “Analysis of the influence of perceived usefulness and ease of use on the user’s mobile visual search behavior intent.”Intelligence work 41.1 (2020): 79-86. DOI: 10.12154/j.qbzlgz.2020.01.009
16. Malatji, William Ratjeana, R. Van Eck, and Tranos Zuva. “Understanding the usage, modifications, limitations and criticisms of technology acceptance model (TAM).” Advances in Science, Technology and Engineering Systems Journal 5.6 (2020): 113-117. DOI: 10.25046/aj050612
17. Sagnier, Camille, Emilie Loup-Escande, Domitile Lourdeaux, Indira Thouvenin &Gerard Vallery. “User acceptance of virtual reality: an extended technology acceptance model.” International Journal of Human–Computer Interaction 36.11 (2020): 993-1007. DOI: 10.1080/10447318.2019.1708612
18. Heer, Jeffrey. “Agency plus automation: Designing artificial intelligence into interactive systems.” Proceedings of the National Academy of Sciences 116.6 (2019): 1844-1850. DOI: 10.1073/pnas.1807184115
19. Goette, Lorenz, and Egon Tripodi. “Social influence in prosocial behavior: evidence from a large-scale experiment.” Journal of the European Economic Association 19.4 (2021): 2373-2398. DOI: 10.1093/jeea/jvaa054
20. Lim, Weng Marc. “Toward a theory of social influence in the new normal.” Activities, Adaptation & Aging 46.1 (2022): 1-8. DOI: 10.1080/01924788.2022.2031165
21. Ventre, Ivan, and Diana Kolbe. “The impact of perceived usefulness of online reviews, trust and perceived risk on online purchase intention in emerging markets: A Mexican perspective.” Journal of International Consumer Marketing 32.4 (2020): 287-299. DOI: 10.1080/08961530.2020.1712293
22. Zaineldeen, Samar, Hongbo Li, Aka Lucien Koffi, Bilal Mohammed. “Technology acceptance model’concepts, contribution, limitation, and adoption in education.” Universal Journal of Educational Research 8.11 (2020): 5061-5071. DOI: 10.13189/ujer.2020.081106
23. Pitafi, Abdul Hameed, Shamsa Kanwal, and Ali Nawaz Khan. “Effects of perceived ease of use on SNSs-addiction through psychological dependence, habit: The moderating role of perceived usefulness.” International Journal of Business Information Systems 33.3 (2020): 383-407. DOI: 10.1504/IJBIS.2020.105831
24. Kemp, Andrew, Edward Palmer, and Peter Strelan. “A taxonomy of factors affecting attitudes towards educational technologies for use with technology acceptance models.” British Journal of Educational Technology 50.5 (2019): 2394-2413. DOI: 10.1111/bjet.12833
25. Liu Qiping, He Guoqing, and Wang Weijun. “Research on the continuous use behavior of users of knowledge-based payment platform based on qualitative analysis.”Intelligence Science 37.7 (2019): 133-138. DOI: CNKI:SUN:QBKX.0.2019-07-022
26. Ma Zhihao, Ge Jinping, and Zhou Xiang. “The continuous use behavior and subjective well-being of webcast users--based on the expectation confirmation model and the theoretical perspective of quasi-social relations.”News and Communication Review 73.2 (2020): 29-46. DOI: CNKI:SUN:WHDS.0.2020-02-004
27. Ambarwati, Rita, Yuda Dian Harja, and Suyono Thamrin. “The role of facilitating conditions and user habits: a case of Indonesian online learning platform.” The Journal of Asian Finance, Economics and Business 7.10 (2020): 481-489. DOI: 10.13106/jafeb.2020.vol7.no10.481
28. Daneji, Aisha Aminu, Ahmad Fauzi Mohd Ayub, and Mas Nida Md Khambari. “The effects of perceived usefulness, confirmation and satisfaction on continuance intention in using massive open online course (MOOC).” Knowledge Management & E-Learning 11.2 (2019): 201-214. DOI: 10.34105/j.kmel.2019.11.010.
29. Dong Qingxing, Zhou Xin, Mao Fenghua, Zhang Bin. “Research on the continuous willingness of users in online health communities to use-based on the theory of perceived value.”Modern Intelligence 39.3 (2019):3-14. DOI: 10.3969/j.issn.1008-0821.2019.03.001
30. Zhao Xueqin, and Wang Shaochun. “An investigation on the influencing factors of WeChat mini program users’ willingness to continue to use it.”Modern intelligence 39.6 (2019): 70-80. DOI: 10.3969/j.issn.1008-0821.2019.06.008
FINANCING
No financing.
CONFLICT OF INTEREST
The authors declare that there is no conflict of interest.
AUTHORSHIP CONTRIBUTION
Formal analysis: Lizawati Binti Mi Yusuf.
Supervision: Mohd Shahizan Bin Othman.
Display: Xuying Sun.
Drafting - original draft: Linnan Zhu.
Writing - proofreading and editing: Mohd Shahizan Bin Othman.