ORIGINAL
Investigating the role of energy consumption, ecological innovations, institutional quality and economic growth on ecological sustainability: a study from UAE
Investigación sobre el papel del consumo de energía, innovaciones ecológicas, calidad institucional y crecimiento económico en la sostenibilidad ecológica: un estudio en los EAU
Mohammed Abudaqa1 ![]() *, Hasnida Ab-Samat1
*, Hasnida Ab-Samat1 ![]() *
*
1School of Mechanical Engineering, Universiti Sains Malaysia. Penang, Malaysia.
Cite as: Abudaqa M, Ab-Samat H. Investigating the role of energy consumption, ecological innovations, institutional quality and economic growth on ecological sustainability: a study from UAE. Salud, Ciencia y Tecnología - Serie de Conferencias. 2024; 3:.754. https://doi.org/10.56294/sctconf2024.754
Submitted: 24-02-2024 Revised: 09-05-2024 Accepted: 18-09-2024 Published: 19-09-2024
Editor: Dr.
William Castillo-González ![]()
Corresponding Author: Mohammed Abudaqa *
ABSTRACT
In the contemporary world, the issue of a sustainable environment is under significant attention by researchers and policymakers. However, the role of energy sources, both in terms of renewable and non-renewable, cannot be ignored in determining environmental pollution and related issues. This study aims to examine the trends in environmental sustainability as measured through carbon dioxide emissions while considering the role of renewable energy, non-renewable energy, ecological innovation, institutional quality, and economic growth in the United Arab Emirates (UAE). The time period of the study consists of 1995-2020 with yearly observations. For the purpose of literature discussion, both theoretical and empirical studies have been covered through critical analysis.
Furthermore, this study considers novel approaches entitled auto-regressive distributed lag (ARDL) in order to estimate the relationships between the variables. The initial results confirm the presence of stationarity properties and the cointegrated association between the variables of interest. On the other side, the long-run results through ARDL show that renewable energy, ecological innovations, institutional quality, and square of economic growth are playing their significant and productive role in reducing carbon emissions. On the other side, non-renewable energy sources and economic growth are causing more carbon emissions, hence confirming the presence of the Environmental Kuznets Curve (EKC). Based on such findings, several policy suggestions have been provided along with limitations and future directions.
Keywords: Renewable Energy; Non-Renewable Energy; Carbon Emission; UAE.
RESUMEN
En el mundo contemporáneo, el tema de un entorno sostenible recibe una atención significativa por parte de investigadores y responsables de políticas. Sin embargo, el papel de las fuentes de energía, tanto renovables como no renovables, no puede ser ignorado al determinar la contaminación ambiental y los problemas relacionados. Este estudio tiene como objetivo examinar las tendencias en sostenibilidad ambiental, medida a través de las emisiones de dióxido de carbono, considerando el papel de la energía renovable, la energía no renovable, la innovación ecológica, la calidad institucional y el crecimiento económico en los Emiratos Árabes Unidos (EAU). El período de estudio abarca desde 1995 hasta 2020 con observaciones anuales. Para la discusión de la literatura, se han abordado tanto estudios teóricos como empíricos a través de un análisis crítico.Además, este estudio emplea enfoques novedosos denominados auto-regresivo distribuido (ARDL) para estimar las relaciones entre las variables. Los resultados iniciales confirman la presencia de propiedades de estacionariedad y la asociación cointegrada entre las variables de interés. Por otro lado, los resultados a largo plazo mediante ARDL muestran que la energía renovable, las innovaciones ecológicas, la calidad institucional y el cuadrado del crecimiento económico juegan un papel significativo y productivo en la reducción de las emisiones de carbono. En contraste, las fuentes de energía no renovables y el crecimiento económico están provocando más emisiones de carbono, confirmando así la presencia de la Curva de Kuznets Ambiental (EKC). Con base en estos hallazgos, se han proporcionado varias sugerencias de política, así como limitaciones y direcciones futuras.
Palabras clave: Energía Renovable; Energía no Renovable; Emisiones de Carbono; EAU.
INTRODUCTION
Meeting the rising energy demands is crucial for countries and industries to improve living standards, ensure production, and minimize pollution.(1,2) Currently, fossil fuels such as coal and natural gas predominantly address these energy needs, leading to increased carbon dioxide emissions (CEM) and environmental pollution.(3,4) Consequently, there is a growing emphasis on renewable energy sources like geothermal, wind, solar, biofuels, and biomass to mitigate environmental damage.(5,6,7)
Technological advancements have significantly boosted interest in renewable energy due to concerns about pollution and the depletion of fossil fuels. Figure 1 illustrates global energy consumption trends from various sources, highlighting coal and oil as the primary non-renewable energy sources since the 1800s, contributing to environmental degradation.(8)
Institutional quality (INQ) has gained attention from policymakers and international agencies focusing on environmental protection.(9) Among governance dynamics, the rule of law is crucial for ensuring environmental health, reducing market failure, and controlling carbon emissions.(10) Governments can impose environmental regulations and taxes to promote energy efficiency, reduce fossil fuel consumption, and stimulate growth in the renewable energy sector.(11)
Ecological innovation (EINO) is another key factor in reducing material and energy consumption, lowering emissions, and promoting recycling.(12,13) In the UAE, innovation is integral to the "United in Knowledge" pillar of Vision 2021, aiming to build a competitive economy. The UAE's focus on green economy initiatives and ecological innovations reflects its commitment to sustainability.(14,15)
The issue of environmental sustainability, marked by rising carbon dioxide emissions, has become increasingly significant since the early 20th century.(16,17) Figure 2 shows the growth in global carbon emissions, driven by increased fossil fuel consumption. Researchers and policymakers are now focusing on the impact of energy consumption on carbon emissions and climate change.(18,19)
Based on these arguments, this study explores the trends in ecological sustainability in the UAE over recent decades, considering energy consumption, eco-innovations, institutional quality, and economic growth using autoregressive distributed lag (ARDL) estimation.
Literature review
Relationship between Renewable Energy and Environmental Sustainability
Recent studies have extensively examined the link between renewable energy sources and environmental sustainability. One study(20) explored the impact of renewable energy (REN) utilization on environmental degradation in the top ten polluted countries from 1990-2017 using quantile regression and Granger causality. They found a significant negative relationship between REN and environmental degradation in countries like the USA, Japan, China, Brazil, Canada, Germany, and South Korea, suggesting that increased REN consumption can reduce ecological deterioration. Another study(21) also highlighted the negative impact of REN on environmental degradation in Pakistan from 1980-2018, emphasizing the importance of clean energy in mitigating carbon emissions.
Relationship between Non-Renewable Energy and Environmental Sustainability
The harmful effects of non-renewable energy (NREN) on environmental sustainability have been widely studied. One investigation(22) examined the impact of NREN on carbon dioxide emissions in eight Sub-Saharan African economies from 1980-2014, finding that NREN significantly increases carbon emissions. Another study(23) observed a mixed effect of NREN on carbon emissions in African economies from 1980-2015, with some countries like Nigeria showing a positive relationship between NREN consumption and economic growth, while others showed reduced carbon emissions.
Relationship between Institutional Quality and Environmental Sustainability
Institutional quality (INQ) plays a crucial role in environmental sustainability. One study(9) examined the relationship between INQ, economic growth, and carbon emissions in Thailand, Indonesia, and South Korea from 1990-2016. They found a significant one-way causality from INQ to economic growth, carbon emissions, and energy consumption, highlighting the importance of strong institutions in controlling carbon emissions. Another study(24) confirmed that INQ, such as control over corruption and regulatory quality, significantly reduces carbon emissions in 30 Sub-Saharan African economies, supporting the Environmental Kuznets Curve (EKC) hypothesis.
Relationship between Ecological Innovation and Environmental Sustainability
Ecological innovation (EINO) is critical in addressing environmental issues like carbon emissions. One analysis(25) investigated the impact of innovation and technology investment on carbon emissions in OECD economies from 2000-2014, finding that innovation significantly reduces emissions. Another study(26) investigated the effect of environmental innovation in China from 2000-2013, revealing that innovation effectively reduces carbon emissions.
Relationship between Economic Growth and Environmental Sustainability
The relationship between economic growth and environmental sustainability has received significant attention. One study(27) examined the impact of economic growth, industrialization, and urbanization on carbon emissions in China from 1978-2011, finding that increased GDP, population, and industrialization significantly contribute to carbon emissions. Another study(28) conducted a literature survey on the causality relationships between economic growth, energy consumption, and carbon emissions, concluding that highly developing economies show a direct relationship between economic growth and carbon emissions, while developed economies show less evidence of this nexus.
METHOD
This is a quantitative empirical study, utilizing econometric modeling to analyze the relationship between various forms of energy consumption, ecological innovations, institutional quality, economic growth, and carbon emissions. This study employs an Autoregressive Distributed Lag (ARDL) model, which is implemented in three stages:
Unrestricted Error Correction Model: This step determines if there is a long-run association between the variables.
Cointegration Check: If cointegration is present, we estimate the long-term relationship coefficients.
Short-Run Coefficients Estimation: We obtain short-run coefficients.
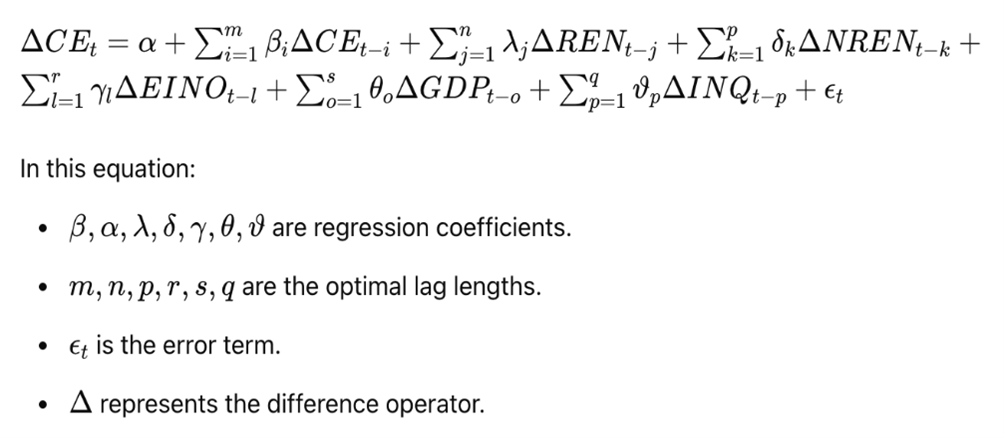
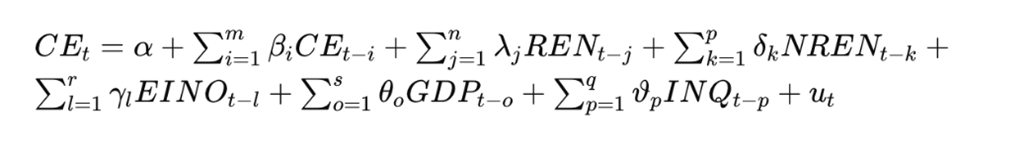
The ARDL model for this study is specified as follows:
The F-test is used to check for cointegration among the variables:
If the F-test value is lower than the critical value from Pesaran et al. (2001), we cannot reject the null hypothesis (H₀) of no cointegration.
If the F-test value exceeds the critical value, we accept the alternative hypothesis (H₁) of cointegration.
For the long-term relationship, the ARDL model is further specified:
After determining the long-term coefficients, we estimate the Error Correction Model (ECM) to derive short-term coefficients:
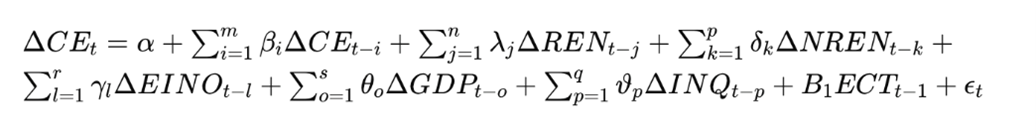
Where:
ECTt−1 is the error correction term.
B₁ indicates how quickly deviations from long-term equilibrium are corrected, expected to be negative and between 0 and 1.
This study also tests the Environmental Kuznets Curve (EKC) hypothesis using the ARDL model.
Table 1 provides an overview of the measurement of the study variables and their key sources for data collection over time, helping readers better understand
|
Table 1. Measurement of the Variables |
|||
|
Variable Name |
Abbreviation |
Measurement |
Data Source |
|
Carbon Emission |
CEM |
The title of CE will be measured through kiloton or KT. |
World development Indicator or WDI |
|
Renewable Energy |
REN |
The title of renewable energy is measured through percentage of renewable energy in total energy consumption in a given time. |
World Development Indicator WDI |
|
Non-renewable Energy |
NREN |
The title of non-renewable energy consumption is measured through fossil fuel energy consumption as a percentage of total. |
World Development Indicator WDI |
|
Ecological Innovations |
EINO |
Environmental patents as % of total patents |
OECD website |
|
|
|
|
|
|
Institutional Quality |
INQ |
Rule of Law, Estimate of governance (ranges from approximately -2,5 (weak) to 2,5 (strong) governance performance) |
WGI database |
|
Economic Growth through Gross domestic Product |
GDP |
Measured through GDP growth |
WDI database |
RESULTS
Descriptive Outcomes
Based on the data collected from different sources, as mentioned in table 2, the current section provides the historical trends of the data. For covering the data trends, descriptive scores are very useful. As stated earlier, the purpose of descriptive statistics is to examine both the measure of central tendency and the measure of dispersion. It shows that all the study variables except institutional quality and renewable energy have a negative mean score. However, the highest mean score is linked with the linked with the CEM observed as taking the natural log of the historical value.
the descriptive score for the economic growth via GDP indicates a mean score of 4,556 as measured through the natural log for the GDP per capita over the study period. Moreover, the deviation in the mean score for GDP is observed as 0,072. The historical trend for the economic growth per capita of UAE is reflected in figure 1, which demonstrates that a dramatic growth trend has been recorded. More specifically, it shows that during 2008, UAE achieved the highest level of GDP per capita, which is 44498,94. On the other side, the lowest GDP per capita was 27221,93 in 1995. As per the latest data, the GDP per capita for the UAE is 42701,44, hence reflecting a remarkable growth in the economy. Although these figures are valuable enough to claim the economic progress in the region; however, this growing trend in the economy is not sustainable in nature due to more dependency on traditional energy sources for the production of goods and services.
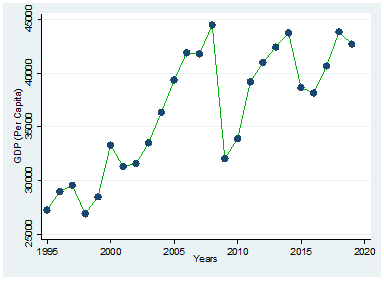
Figure 1. Historical Trend of Economic Growth in UAE
|
Table 2. Descriptive Statistics |
|||||
|
Variable |
Obs. |
Mean |
Std. Dev. |
Min |
Max |
|
CEM |
25 |
5,111 |
0,15 |
4,876 |
5,303 |
|
REN |
25 |
-0,952 |
0,223 |
-1,22 |
-0,17 |
|
NREN |
25 |
1,976 |
0,032 |
1,92 |
2 |
|
EINO |
20 |
0,986 |
0,217 |
0,46 |
1,3 |
|
INQ |
24 |
0,7575 |
0,222 |
0,322 |
1,12 |
|
GDP |
25 |
4,556 |
0,072 |
4,43 |
4,65 |
|
CEM: carbon emission, REN; renewable energy, NREN; non-renewable energy, EINO; ecological innovation, INQ; institutional quality, GDP; gross domestic product |
|||||
Correlation Matrix of the Study
As per the findings in table 3, the results show the following:
· Negative correlation between CEM and renewable energy (-0,426, p=0,034).
· Positive correlation between CEM and fossil fuel energy consumption (0,710, p=0,000).
· Negative correlation between ecological innovation and CEM (-0,489, p=0,029).
· Positive correlation between CEM and GDP (0,807, p=0,000).
|
Table 3. Pairwise Correlations |
||||||
|
Variables |
(1) |
(2) |
(3) |
(4) |
(5) |
(6) |
|
(1) CEM |
1,000 |
|
|
|
|
|
|
|
(0,759) |
|
|
|
|
|
|
(2) REN |
-0,426* |
1,000 |
|
|
|
|
|
|
(0,034) |
|
|
|
|
|
|
(3) NREN |
0,710* |
-0,623* |
1,000 |
|
|
|
|
|
(0,000) |
(0,001) |
|
|
|
|
|
(4) EINO |
-0,489* |
-0,115 |
-0,198 |
1,000 |
|
|
|
|
(0,029) |
(0,628) |
(0,404) |
|
|
|
|
(5) INQ |
-0,136 |
0,395 |
-0,643* |
-0,125 |
1,000 |
|
|
|
(0,525) |
(0,056) |
(0,001) |
(0,599) |
|
|
|
(6) GDP |
0,807* |
-0,434* |
-0,578* |
0,152 |
0,307 |
1,000 |
|
|
(0,000) |
(0,030) |
(0,002) |
(0,522) |
(0,145) |
|
|
CEM: carbon emission, REN; renewable energy, NREN; non-renewable energy, EINO; ecological innovation, INQ; institutional quality, GDP; gross domestic product, * indicates significance level at 5 % |
||||||
The variance inflation factor (VIF) results in table 4 confirm no significant
multicollinearity among the variables, with all VIF values below 5.
|
Table 4. Variance inflation factor |
||
|
Variables |
VIF |
1/VIF |
|
NREN |
2,973 |
0,336 |
|
INQ |
1,873 |
0,534 |
|
REN |
1,827 |
0,547 |
|
GDP |
1,364 |
0,733 |
|
EINO |
1,313 |
0,761 |
|
Mean VIF |
1,87 |
0 |
|
CEM: carbon emission, REN; renewable energy, NREN; non-renewable energy, EINO; ecological innovation, INQ; institutional quality, GDP; gross domestic product |
||
Checking the Normality Tend
For this purpose, Jerque-Bera (JB) tests provide the test statistics along with the probability values. The checking of the normal distribution of the data is conducted by considering the following null and alternative hypotheses.
· H0: Data is normally distributed.
· H1: Data is not distributed normally.
The test results show that for the study variables like CEM, renewable energy, non-renewable energy, ecological innovation, institutional quality, and gross domestic products, the relative JB scores are 7,362, 228,4, 8,353, 9,629, 1,305, and 15,05, respectively. On the other side, the probability values for these test statistics are significant at 5 %, except for the institutional quality. This shows that all the study variables except INQ in terms of data normality are rejecting H0 while accepting the fact that data is not normally distributed.
|
Table 5. JB test Output |
||
|
Variable |
JB |
Probability |
|
CEM |
7,362 |
0,015 |
|
REN |
228,4 |
0,000 |
|
NREN |
8,353 |
0,002 |
|
EINO |
9,629 |
0,027 |
|
INQ |
1,305 |
0,152 |
|
GDP |
15,05 |
0,005 |
|
CEM: carbon emission, REN; renewable energy, NREN; non-renewable energy, EINO; ecological innovation, INQ; institutional quality, GDP; gross domestic product |
||
Checking the Stationarity Properties
ADF test is regarded as more reliable in dealing with the unit root of the data compared to Dicky-Fuller test. For applying the ADF unit root test, following null and alternative hypotheses have been considered.
· H0: there is a presence of unit root in the data/ or there is a non-stationarity trend in the data
· H1: there is a no presence of unit root in the data/ or there is a stationarity trend in the data.
The findings for the ADF unit root are presented in table 6 for the study variables entitled CEM, renewable energy, non-renewable energy, ecological innovation, institutional quality, and gross domestic product over the study time duration. The results are presented both at level and ADF (Δ) where it is observed that the findings through ADF at level are observed as statistically insignificant for all of the study variables except for NREN. Therefore, the first-order difference has been created, and ADF (Δ) has been applied. The findings at ADF (Δ) report that all the variables have shown significant outcomes at 5 % for the CEM and at 1 % for the rest of the variables. Therefore, this research accepts H1 to claim that data has become stationarity.
|
Table 6. ADF Unit Root Test Results |
||
|
Variable |
ADF (level) |
ADF (Δ) |
|
CEM |
1,948 |
-2,091** |
|
REN |
-1,504 |
-4,039*** |
|
NREN |
-2,041** |
-2,625** |
|
EINO |
-0,609 |
-4,618** |
|
INQ |
0,336 |
-2,837*** |
|
GDP |
0,586 |
-4,191*** |
|
CEM: carbon emission, REN; renewable energy, NREN; non-renewable energy, EINO; ecological innovation, INQ; institutional quality, GDP; gross domestic product |
||
In addition, table 7 provides the outcomes for the Phillips-Perron test for unit root which also justify the presence/non-presence of the unit root in the data. The results show that like ADF, the findings are observed as statistically significant at 1 % for the study variables named CEM, renewable energy, non-renewable energy, institutional quality, ecological innovations, and gross domestic product. As these results are consistent with the ADF, therefore, it is inferred that data has become stationarity at first difference for these variables.
|
Table 7. Test Results for the PP unit root test as Cross Check |
||
|
Variable |
PP (level) |
PP (Δ) |
|
CEM |
0,702 |
-16,088*** |
|
REN |
8,272** |
28,208*** |
|
NREN |
-0,180 |
-24,138*** |
|
EINO |
-1,097 |
-26,192*** |
|
INQ |
0,192 |
-28,068*** |
|
GDP |
0,298 |
-24,231*** |
|
CEM, PM2,5: particulate matter 2,5, REN; renewable energy, NREN; non-renewable energy, EINO; ecological innovation, INQ; institutional quality, GDP; gross domestic product |
||
To test whether there is a cointegrated association between the variables or not, the following null and alternative hypotheses have been tested.
· H0: there is no cointegrated relationship between the variables.
· H1: there is a cointegrated relationship between the variables.
As per the findings in table 8, it is observed that the F-test value is found to be highly significant at 1 %. Therefore, it is inferred that there is a cointegrated relationship between the variables; hence, H1 is accepted when the model is based on the CEM as key dependent variable. These results further confirm that there is a long-run relationship between the variables. Moreover, the diagnostic findings are also presented in table 7. For testing the auto-correlation, Durbin Watson test scores ranging from 0-4. The value of 2 indicates there is no auto-correlation, whereas zero reflects positive autocorrelation. Finally, the score of 4 shows strongly negatively serial correlation. As the value of Durbin-Watson is 2,32 is near to 2, therefore, it is claimed that there is no autocorrelation in the model.
In addition, the table 8 reports the Heteroskedasticity test for the model for which the p-value is 0,3858. To examine whether there is a presence of Heteroskedasticity in the model, following null and alternative hypotheses have been tested.
· H0: there is no presence of Heteroskedasticity in the model.
· H2: there is a presence of Heteroskedasticity in the model.
The value of Heteroskedasticity is 0,3856, which is insignificant even at 10 %. Therefore, it is inferred that heteroskedasticity is absent from the model; hence, H0 is not rejected.
|
Table 8. Diagnostics tests and bound Test |
||||
|
Dependent Variable |
Model ARDL |
Bound Test F-value |
Durbin-Watson d-statistic |
Heteroskedasticity (P-value) |
|
CEM |
2 2 2 2 2 1 |
27,000*** |
2,32 |
0,3856 |
DISCUSSION
Impact of Renewable Energy on CEM
Renewable Energy (REN) and CEM: the study found that a 1 % increase in renewable energy usage leads to a 0,644 % decrease in carbon emissions (CEM) in the UAE. This indicates that higher consumption of renewable energy improves environmental sustainability by reducing CEM.
Mechanism and Literature Support: renewable energy reduces dependence on fossil fuels, thus enhancing environmental quality. Literature supports this, with studies like Saidi et al.(29) and Jin et al.(30) showing that renewable energy consumption can reduce CEM and promote economic growth.
Key Literature Examples
· Saidi and Omri (2020): studied 15 renewable energy economies and found that REN promotes economic growth and reduces CEM, but there is no long-term causal relationship.(29)
· Jin and Kim (2018): found that both REN and nuclear energy reduce CEM in the short run.(30)
· Yuping et al. (2021): found a long-run relationship between REN and CEM in Argentina, suggesting policy implications for renewable energy usage.(31)
Impact of Non-Renewable Energy Consumption on CEM
Non-Renewable Energy (NREN) and CEM: a 1 % increase in non-renewable energy consumption leads to a 0,022 % increase in CEM, indicating significant environmental harm from fossil fuels. The t-value of 23,230 confirms a highly significant impact.
Key Literature Examples
· Chen, Wang, et al. (2019): found that non-renewable energy increases CEM in China, causing environmental issues.(32)
· Awodumi et al. (2020): found that oil and natural gas consumption drive economic growth but also increase CEM in African oil-producing economies.(33)
Impact of Ecological Innovations on CEM
Ecological Innovations (EINO) and CEM: ecological innovations have a negative impact on CEM, with a coefficient of -0,037 and a t-value of 23,840, indicating significant results. These innovations reduce dependency on fossil fuels and promote sustainability.
Key Literature Examples
· Wang et al. (2020): found that ecological innovations in G-7 economies reduce CEM.(34)
· Shan et al. (2021): emphasized the role of green technology in achieving carbon neutrality targets post-Paris Climate Agreement.(35)
Impact of Institutional Quality on CEM
Institutional Quality (INQ) and CEM: there is a significant negative impact of INQ on CEM in the UAE, with a coefficient of -0,719. Improved institutional quality leads to better ecological outcomes and lower CEM.
Key Literature Examples
· Salman et al. (2019): Found that better institutional quality reduces CEM in Indonesia, Thailand, and South Korea.(36)
· Khan et al. (2022): Highlighted the importance of institutional quality in moderating the relationship between energy consumption, economic growth, and CEM.(37)
Impact of Economic Growth on CEM
Economic Growth (GDP) and CEM: economic growth positively impacts CEM, with a coefficient of 0,943. This suggests that current economic growth models in the UAE are not sustainable as they lead to higher CEM.
Key Literature Examples
· Zhang et al. (2014): found a cointegrated relationship between GDP and CEM in China.(26)
· Waheed et al. (2019): concluded that economic growth and energy consumption are primary sources of CEM, especially in developing economies.(28)
Impact of Square of Economic Growth on CEM
Square of Economic Growth (GDP²) and CEM: The coefficient of -0,0368 indicates a negative impact, suggesting that beyond a certain level, economic growth reduces CEM, supporting the Environmental Kuznets Curve (EKC) hypothesis.
Key Literature Examples
· Chen Zhao, et al. (2019): validated the EKC hypothesis in the western region of China.(32)
· Murshed et al. (2022): found EKC validation for India and Bangladesh, but not for Pakistan.(33)
The study confirms a significant long-term association between renewable and non-renewable energy consumption, ecological innovations, institutional quality, economic growth, and CEM in the UAE. It validates the EKC hypothesis, indicating that economic growth initially increases CEM but eventually leads to environmental improvements.
CONCLUSIONS
The escalating environmental pressure due to increased carbon emissions (CEM) is a pressing issue in the UAE, necessitating strategic policy interventions. This study provides several key policy recommendations along with their practical implications.
The negative impact of renewable energy on CEM, as evidenced by the significant coefficients under ARDL and various quantiles, underscores the need for proactive measures. The UAE government, along with relevant authorities and environmental representatives, must prioritize the promotion of energy-efficient infrastructure. Specifically, the government needs to offer substantial financial support to the clean energy sector to minimize ecological impacts. This support should include enhancing the financial sector’s infrastructure to improve the overall contribution of green energy to the national energy system. Given the high costs associated with developing clean energy infrastructure, it is also essential for the government to support private firms, as neglecting this sector could impede renewable energy development.
Furthermore, the energy policy should facilitate a transition from non-renewable to renewable sources, particularly during the early stages of economic development. This approach aligns with Gielen et al. (2019), who highlight the link between energy consumption and economic growth. The UAE's energy policy must be realistic and aligned with the efficient extraction and utilization of current natural resources. It should focus on renewable sources like wind and photovoltaic power, addressing the challenges of variable energy supply and high storage costs. Developing an effective inter-regional power distribution system, supported by reasonable subsidies or compensations, is crucial.
The shift towards green energy not only benefits the environment but also has positive economic implications. Increasing renewable energy consumption will foster green economic growth, enhance total factor productivity, and improve national income, thus providing a sustainable solution from multiple perspectives. Economic growth, in turn, generates resources for research and development in clean energy technologies. Policymakers should therefore create incentives to support the development and accessibility of green energy.
Encouraging private investment through Public-Private Partnerships (PPP) and removing investment barriers is another essential step for promoting renewable energy in the UAE.
Conversely, the empirical findings indicate that higher consumption of non-renewable fossil fuels contributes to environmental degradation. It is recommended that the UAE government increase the share of clean energy in its total energy consumption and phase out fossil fuel subsidies in favor of renewable energy investment. Initial substantial investment is required for clean energy promotion and technological upgrades. Shifting from fossil fuels to cleaner sources will have significant societal benefits, justifying state subsidies for renewable energy. Implementing laws similar to China's "renewable energy" legislation could further promote clean energy and address high levels of CEM.
Additionally, reducing reliance on traditional coal and gas energy and promoting alternative sources such as hydro, wind, and solar power will help lower carbon dioxide emissions. Given the UAE's high per capita income, preferential pricing policies for clean energy should be considered. Finally, encouraging industries to transition to cleaner energy sources through financial and non-financial incentives will support a more sustainable energy framework.
BIBLIOGRAPHIC REFERENCES
1. Kamran, H. W., Rafiq, M., Abudaqa, A., & Amin, A. (2024). Interconnecting sustainable development goals 7 and 13: the role of renewable energy innovations towards combating the climate change. Environmental Technology, 45(17), 3439–3455.
2. Güney, T. (2019). Renewable energy, non-renewable energy and sustainable development. International Journal of Sustainable Development World Ecology, 26(5), 389-397.
3. Sharif, A., Raza, S. A., Ozturk, I., & Afshan, S. (2019). The dynamic relationship of renewable and nonrenewable energy consumption with carbon emission: a global study with the application of heterogeneous panel estimations. Renewable Energy, 133, 685-691.
4. Dogan, E., & Seker, F. J. R. E. (2016). Determinants of CO2 emissions in the European Union: the role of renewable and non-renewable energy. Energy Economics, 94, 429-439.
5. Alemán-Nava, G. S., Casiano-Flores, V. H., Cárdenas-Chávez, D. L., Díaz-Chavez, R., Scarlat, N., Mahlknecht, J., . . . Parra, R. (2014). Renewable energy research progress in Mexico: A review. Renewable Sustainable Energy Reviews, 32, 140-153.
6. Sayed, E. T., Wilberforce, T., Elsaid, K., Rabaia, M. K. H., Abdelkareem, M. A., Chae, K.-J., & Olabi, A. (2020). A critical review on Environmental Impacts of Renewable Energy Systems and Mitigation Strategies: Wind, Hydro, Biomass and Geothermal. Science of The Total Environment, 144505.
7. Tafavogh, M., & Zahedi, A. (2021). Design and production of a novel encapsulated nano phase change materials to improve thermal efficiency of a quintuple renewable geothermal/hydro/biomass/solar/wind hybrid system. Renewable Energy, 169, 358-378.
8. Smil, V. J. H. (2017). Energy Transitions: Global and National Perspectives. & BP Statistical Review of World Energy. 15, 2020.
9. Salman, M., Long, X., Dauda, L., & Mensah, C. N. (2019). The impact of institutional quality on economic growth and carbon emissions: Evidence from Indonesia, South Korea and Thailand. Journal of Cleaner Production, 241, 118331.
10. Welsch, H. (2004). Corruption, growth, and the environment: a cross-country analysis. Environment Development Economics, 9(5), 663-693.
11. IPCC.International Energy Agency. (2016). Energy consumption and climate change. IEA Rep.
12. Melnykovych, M., Nijnik, M., Soloviy, I., Nijnik, A., Sarkki, S., & Bihun, Y. (2018). Social-ecological innovation in remote mountain areas: Adaptive responses of forest-dependent communities to the challenges of a changing world. Science of The Total Environment, 613, 894-906.
13. Sudakaran, S., Kost, C., & Kaltenpoth, M. (2017). Symbiont acquisition and replacement as a source of ecological innovation. Trends in Microbiology, 25(5), 375-390.
14. Government of UAE. (2021). Innovation. Retrieved from https://u.ae/en/about-the-uae/the-uae-government/government-of-future/innovation-in-the-uae
15. ITU. (2021). Growing a green economy in the UAE: From theory to practice with ICTs. Retrieved from https://www.itu.int/en/myitu/News/2020/10/27/08/22/Green-economy-UAE-theory-practice-ICTs
16. Koondhar, M. A., Shahbaz, M., Ozturk, I., Randhawa, A. A., & Kong, R. (2021). Revisiting the relationship between carbon emission, renewable energy consumption, forestry, and agricultural financial development for China. Environmental Science Pollution Research, 1-15.
17. Li, Z.-Z., Li, R. Y. M., Malik, M. Y., Murshed, M., Khan, Z., & Umar, M. (2021). Determinants of carbon emission in China: how good is green investment? Sustainable Production Consumption, 27, 392-401.
18. International Energy Agency. (2016). Energy consumption and climate change. IEA Rep.
19. Johra, H., Weiss, T., Péan, T., Derakhtenjani, A. S., Candanedo, J., Athienitis, A., . . . Kazmi, H. (2019). International Energy Agency-Examples of Energy Flexibility in Buildings: Energy in Buildings and Communities Programme Annex 67 Energy Flexible Buildings: Danish Technological Institute.
20. Sharif, A., Mishra, S., Sinha, A., Jiao, Z., Shahbaz, M., & Afshan, S. (2020). The renewable energy consumption-environmental degradation nexus in Top-10 polluted countries: Fresh insights from quantile-on-quantile regression approach. Renewable Energy, 150, 670-690.
21. Chien, F., Ajaz, T., Andlib, Z., Chau, K. Y., Ahmad, P., & Sharif, A. (2021). The role of technology innovation, renewable energy and globalization in reducing environmental degradation in Pakistan: A step towards sustainable environment. Renewable Energy, 177, 308-317.
22. Vural, G. (2020). How do output, trade, renewable energy and non-renewable energy impact carbon emissions in selected Sub-Saharan African Countries? Resources Policy, 69, 101840.
23. Awodumi, O. B., & Adewuyi, A. O. (2020). The role of non-renewable energy consumption in economic growth and carbon emission: Evidence from oil producing economies in Africa. Energy Strategy Reviews, 27, 100434.
24. Karim, S., Appiah, M., Naeem, M. A., Lucey, B. M., & Li, M. (2022). Modelling the role of institutional quality on carbon emissions in Sub-Saharan African countries. Renewable Energy, 198, 213-221. doi: https://doi.org/10.1016/j.renene.2022.08.074
25. Ganda, F. (2019). The impact of innovation and technology investments on carbon emissions in selected organisation for economic Co-operation and development countries. Journal of Cleaner Production, 217, 469-483. doi: https://doi.org/10.1016/j.jclepro.2019.01.235
26. Zhang, Y.-J., Liu, Z., Zhang, H., & Tan, T.-D. (2014). The impact of economic growth, industrial structure and urbanization on carbon emission intensity in China. Natural Hazards, 73(2), 579-595. doi:10.1007/s11069-014-1091-x
27. Zhang, Y.-J., Peng, Y.-L., Ma, C.-Q., & Shen, B. (2017). Can environmental innovation facilitate carbon emissions reduction? Evidence from China. Energy Policy, 100, 18-28. doi: https://doi.org/10.1016/j.enpol.2016.10.005
28. Waheed, R., Sarwar, S., & Wei, C. (2019). The survey of economic growth, energy consumption and carbon emission. Energy Reports, 5, 1103-1115. doi: https://doi.org/10.1016/j.egyr.2019.07.006
29. Saidi, K., & Omri, A. (2020). The impact of renewable energy on carbon emissions and economic growth in 15 major renewable energy-consuming countries. Environmental Research, 186, 109567. doi: https://doi.org/10.1016/j.envres.2020.109567
30. Jin, T., & Kim, J. (2018). What is better for mitigating carbon emissions – Renewable energy or nuclear energy? A panel data analysis. Renewable and Sustainable Energy Reviews, 91, 464-471. doi: https://doi.org/10.1016/j.rser.2018.04.022
31. Yuping, L., Ramzan, M., Xincheng, L., Murshed, M., Awosusi, A. A., Bah, S. I., & Adebayo, T. S. (2021). Determinants of carbon emissions in Argentina: The roles of renewable energy consumption and globalization. Energy Reports, 7, 4747-4760. doi: https://doi.org/10.1016/j.egyr.2021.07.065
32. Chen, Y., Wang, Z., & Zhong, Z. (2019). CO2 emissions, economic growth, renewable and non-renewable energy production and foreign trade in China. Renewable Energy, 131, 208-216. doi: https://doi.org/10.1016/j.renene.2018.07.047
33. Awodumi, O. B., & Adewuyi, A. O. (2020). The role of non-renewable energy consumption in economic growth and carbon emission: Evidence from oil producing economies in Africa. Energy Strategy Reviews, 27, 100434. doi: https://doi.org/10.1016/j.esr.2019.100434
34. Wang, L., Chang, H.-L., Rizvi, S. K. A., & Sari, A. (2020). Are eco-innovation and export diversification mutually exclusive to control carbon emissions in G-7 countries? Journal of Environmental Management, 270, 110829. doi: https://doi.org/10.1016/j.jenvman.2020.110829
35. Abudaqa, Anas, Al Nuaimi, Seena, Buhazzaa, Hayfa, and Sumaya Al Hosani. “Examining the Significance of Internal Mobility Hiring in Determining the Individual Vs Organizational Outcomes: An Empirical Investigation from ADNOC FURSA Platform During Recent Pandemic of COVID-19.” Paper presented at the Abu Dhabi International Petroleum Exhibition & Conference, Abu Dhabi, UAE, November 2021. doi: https://doi.org/10.2118/207535-MS
36. Salman, M., Long, X., Dauda, L., & Mensah, C. N. (2019). The impact of institutional quality on economic growth and carbon emissions: Evidence from Indonesia, South Korea and Thailand. Journal of Cleaner Production, 241, 118331. doi: https://doi.org/10.1016/j.jclepro.2019.118331
37. Khan, H., Weili, L., & Khan, I. (2022). Institutional quality, financial development and the influence of environmental factors on carbon emissions: evidence from a global perspective. Environmental Science and Pollution Research, 29(9), 13356-13368. doi:10.1007/s11356-021-16626-z
FINANCING
No financing.
CONFLICT OF INTEREST
None.
AUTHORSHIP CONTRIBUTION
Conceptualization: Mohammed Abudaqa, Hasnida Ab-Samat.
Data curation: Mohammed Abudaqa, Hasnida Ab-Samat.
Formal analysis: Mohammed Abudaqa, Hasnida Ab-Samat.
Research: Mohammed Abudaqa, Hasnida Ab-Samat.
Drafting - original draft: Mohammed Abudaqa, Hasnida Ab-Samat.
Writing - proofreading and editing: Mohammed Abudaqa, Hasnida Ab-Samat.