Category: Finance, Business, Management, Economics and Accounting
CASE REPORT
Financial distress analysis for the prediction of corporate bankruptcy – a case study of a public sector company in India
Análisis de dificultades financieras para la predicción de la quiebra de empresas - estudio de caso de una empresa del sector público en la India
1Department of Management Studies, Karpagam Academy of Higher Education. Coimbatore, India.
Cite as: Rejimon A, Usha M. Financial distress analysis for the prediction of corporate bankruptcy – a case study of a public sector company in India. Salud, Ciencia y Tecnología - Serie de Conferencias. 2024; 3:904. https://doi.org/10.56294/sctconf2024904
Submitted: 03-02-2024 Revised: 25-04-2024 Accepted: 11-06-2024 Published: 12-06-2024
Editor:
Dr.
William Castillo-González ![]()
ABSTRACT
Purpose: the present study examines the liquidity of the firm and its impact on financial distress, which may or may not increase the chances of bankruptcy. The study also analyzes the profitability, cash position, and solvency of the firm.
Design/methodology/approach: we use the data of a listed Government manufacturing company and measure the financial distress and probabilities of bankruptcy to test the chances of financial distress during the period between 2015 and 2019. The financial models used for evaluation in the study are the Altman z-score model, Logit Probability model, and Falmur model.
Findings: the study found that there was a chance of bankruptcy in the initial years, but later, it survived the bankruptcy. The study also established that the liquidity and solvency of the firm were not up to the standard.
Practical implications: the result of the study extends our theoretical understanding and also provides valuable guidelines to reduce the chance of insolvency, bankruptcy, and financial distress of firms and to maintain the proper financial health of the firm.
Originality/value: while many empirical studies investigate the relationship between liquidity position and its impact on financially distressed firms in the industry as a whole, but most do not consider the impact of financial distress in an individual firm or company. Most of the published studies use statistical tools for the evaluation of financial distress. This study uses Multiple Discriminant financial model analysis. Multiple Discriminant financial model Analyses are very useful in deciding remedial actions for financial distress problems.
Keywords: Financial Distress; Insolvency; Bankruptcy; Liquidity; Financial Ratios; Financial Distress Models.
RESUMEN
Objetivo: el presente estudio examina la liquidez de la empresa y su impacto en las dificultades financieras, que pueden aumentar o no las posibilidades de quiebra. El estudio también analiza la rentabilidad, la situación de tesorería y la solvencia de la empresa.
Diseño/metodología/enfoque: utilizamos los datos de una empresa manufacturera del Gobierno que cotiza en bolsa y medimos las dificultades financieras y las probabilidades de quiebra para comprobar las probabilidades de dificultades financieras durante el periodo comprendido entre 2015 y 2019. Los modelos financieros utilizados para la evaluación en el estudio son el modelo Altman z-score, el modelo Logit Probability y el modelo Falmur.
Resultados: el estudio encontró que existía la posibilidad de quiebra en los años iniciales, pero más tarde, sobrevivió a la quiebra. El estudio también estableció que la liquidez y la solvencia de la empresa no estaban a la altura de la norma.
Implicaciones prácticas: el resultado del estudio amplía nuestra comprensión teórica y también proporciona directrices valiosas para reducir la probabilidad de insolvencia, quiebra y dificultades financieras de las empresas y para mantener la adecuada salud financiera de la empresa.
Originalidad/valor: aunque muchos estudios empíricos investigan la relación entre la posición de liquidez y su impacto en las empresas con dificultades financieras en el conjunto del sector, la mayoría no tienen en cuenta el impacto de las dificultades financieras en una empresa o compañía individual. La mayoría de los estudios publicados utilizan herramientas estadísticas para evaluar las dificultades financieras. En este estudio se utiliza el análisis de modelos financieros discriminantes múltiples. Los análisis de modelos financieros discriminantes múltiples son muy útiles para decidir medidas correctoras de los problemas financieros.
Palabras clave: Distress Financiero; Insolvencia; Quiebra; Liquidez; Ratios Financieros; Modelos de Distress Financiero.
INTRODUCTION
Financial distress is not a new scenario in the business environment. Nevertheless, financial distress has become an increasingly prominent issue in the past several years since the global downturn in 2008. As a matter of fact, in 2014 the European Commission inaugurated new guidelines formulated to give a cautious indication of financial distress in business enterprises that will help prevent the liquidation of business firms.(1) The global financial crisis until now has had an effect on the financial environment around the world, during this period liquidity is one of the concerns for funding the capital.(2) A greater number of firms that faced financial distress were in their maturity stage of the life cycle but only a very few firms in their growth stage faced financial distress and this may be because the growth firms are likely to be more profitable and have lesser risk.(4,5,6) The corporate world is searching for strategies to predict financial difficulties in advance due to the growing influence of financial distress on the operating results of a firm, its environment (management, credit institutions, stockholders, investors, and employees), and the entire economy.(7,8,9,10,48) Financial distress may create a high-interest expense for the company and this obligation can result in disruption of the company’s working capital which will be reflected in the current ratio as well as in the net working capital.(.11,12,13,46)
As the pace of globalization picks up and competition becomes intense, more and more companies find it tough to survive, which leads to defaults in meeting their debt obligations.(15,16,17,42) The prediction of financial distress is very important in detecting and avoiding financial fraud, misappropriation of money, and prevention of mismanagement of finances.(18,19,20) This necessitates the development and use of an early warning system that can give a reliable measure of a company’s financial health. Companies that appear to be strong today may not be strong tomorrow. Many companies in the Indian Public sector have failed despite being pioneers in their segment and this has been the motivation to undertake this study. It becomes inevitable from a social point of view as most business failures in the Indian Public sector point towards the scarcity and mismanagement of social resources and therefore, this has major social implications too.(30,40) According to Altman(1) with the help of financial statements, Altman computed a list of 22 probably vital financial ratios for the assessment. He classified these variables according to five basic ratios: profitability, liquidity, leverage, solvency, and activity. Those ratios were chosen, on the basis of their importance in literature and their possible relevance to this study.
Tykvová et al.(43) applied a set of measurements measuring liquidity, profitability, and solvency; additionally, they dedicated a set of ratios measuring profitability, liquidity, and activity with a solid theoretical foundation for analysing financial crises. In this regard, we expect the recent international financial crisis to have changed the focus on liquidity, solvency, and the performance of profitability in the Indian government companies. Hence, our research is focused on the chances of liquidation of the firms due to the financial distress and lack of solvency and profitability of Government companies and private companies. We contribute to the literature by examining the distressed firm and analyzing the ill-health of the firms and identifying the impact of liquidity solvency, efficiency, and profitability on financial distress in the firm. We expect the overall liquidity, solvency, efficiency, and profitability deficiency lead to the financial distress of firms. In doing so, the present study aims to give empirical evidence on the impact of short-term and long-term solvency on the distress of the firm by using multivariate and univariate analysis in the selected public sector company. Most of the studies have already been conducted in India and the rest of the world, mainly focused on industries, but this study is based on a single company. Financial distress affects the firms individually and then gradually affects the industry. If the management needs to rectify or prevent the ill health of any industry it would be starting from a single company.
The following are the important objectives of the study. Firstly, to gauge the profitability of the Government company, secondly to study the liquidity and solvency of the Government company, and finally to check the financial distress and possibility of bankruptcy.
By addressing the above objectives this study contributes to the existing theory and practices in the following ways:
In contrast to earlier studies, this one makes the following contributions to the study of financial distress. First, we examine the likelihood of financial distress in the firms and provide fresh data on the connection between liquidity, profitability, efficiency, and solvency.
We contribute to the existing literature in three ways. First, we extend the financial distress literature to the existing literature by examining a firm and how to identify its financial health and ill health. If it is a financially distressed firm, find out the reason or reasons for the financial distress.
Second, we extend the effect of liquidity and solvency by examining its impact on financial distress in government corporations. Company performance and profitability have a vital role in the financial health of firms.
This study makes it possible for the government and the management to take appropriate actions for the revival of the sick and distressed firms. The study throws light on the relevant financial dimensions of the company which will help predict the probability of financial distress. The study also provides vital information to all the stakeholders to identify the reasons behind financial distress and to clear the path to recovery.
The remainder of the paper is structured as follows: literature review, data and methodology, empirical results, and conclusion.
Literature and financial models
Financial distress
Studies that examine the relationship between financial distress and profitability, liquidity, and solvency have mostly suggested a positive and linear association, if these factors are negative then the chances of financial distress and liquidation of firms are very high. According to John(21), Kashyap et al.(22), Platt et al.(32) and Plumley et al.(33) “financial distress is a stage of decline in financial conditions that occurred before the bankruptcy or liquidation experienced by a company”. Meanwhile, according to Foster(16), Konstantaras et al.(23) and Korol(24), financial distress is defined as follows “Financial distress is used to mean server liquidity problems that cannot be resolved without a resizable resolution of the entity’s operations or structure”. Financial distress is always connected with a company’s inefficiency in paying financial obligations or debt when it is demanding.(17,25,26)
Financial distress is the state of affairs that leads to certain financial hardship. Such economic hardship includes the lack of ability to pay debt dues or preference dividends and the analogous results such as negative bank balance, non-payment of creditors and supplier’s dues, and even starting the legal process of bankruptcy proceedings.(27,28,29)
By forecasting corporate financial distress, the root cause of the financial distress and its elucidation can be identified, and corporate bankruptcy can be avoided. In a study carried out,(15) Decision-making units’ efficiency was assessed in different time periods using an accurate forecasting technique.
Financial distress is a situation where the firm is unable to meet its short-term and long-term liabilities and it is accumulating heavy operating loss. Due to the impact of distress, the firms may become insolvent firms and it will lead to liquidation of such firms. Financial distress is a broad view that encompasses many states of affairs under which organizations face some kind of economic deterioration. “Bankruptcy,” “failure,” “insolvency,” and “default” are some of the most usual terminologies used to explain these circumstances. But these terms provide an insignificantly disparate definition related to the peculiar matter or condition of the firm under investigation. However,(2) furnished a much better explanation of “Bankruptcy,” “failure,” “insolvency,” and “default”. The term “financial distress” will be applied in this research paper to explain circumstances where an enterprise is not able to meet payments to its suppliers, and other creditors, and always prefers discriminant analysis to identify this problem. Altman further established that his model could predict accurately for the first year (94 %) and fairly accurately for the second year (72 % for large companies and 93 % for small companies). For Edmister(14) several methods of analyzing financial ratios to forecast small businesses’ financial ruin. Even though not all of the techniques and analyses of all ratios are prognosticators of failure, many ratio analyses are found that do predict the failure of small businesses. The liquidation process cycle may consume 5–6 years which is not an immediate occurrence and inaccessible to forecast. Hence, the adoption of proper financial prediction models can help in the identification of earlier admonition signals and preventive measures can be taken. This may avoid the liquidation of business firms and managers have enough time to take appropriate actions to convert ill-healthy firms into healthy firms.(24,30,31)
Profitability
Profitability is calculating all revenues compared with expenses incurred by the use of assets. Profitability means the ability of a firm to generate profit and the company’s performance is always gaged by profitability. If the profitability level of concern is very high, the possibility of facing financial distress is less than.(8,32,33,34) The primary objective of any organization is to earn high profit which will improve the wealth of shareholders and will attract new investments from the shareholders. A high margin of profit explains management efficiency and reduces the distress chances.(35,36,37)
Profitability and liquidity are very vital elements for the smooth and successful management of the business. The result of the studies is that financial distress destroys the business and is a costly event and there are several studies in the Indian context on government company’s financial distress.(5,38,39,40) The outcome of the research study shows that profitability has an impact on financial distress.(6,41)
The results predicted that the financial situation was decided by profitability, liquidity, and trading on equity factors, that is, the lesser profitability and liquidity and the higher the trading on equity, the higher the risk of being in a poor financial position. Solvency refers to a firm’s long-term financial sustainability and its capacity to settle its long-term financial obligations and long-term solvency or trading on equity analysis depends on the total impact of financing, investing, and operating activities.(23) Accounting ratios are numerically very important and if it is negative, implying poor economic performance and it may be an insolvent firm, and is positive, explaining good performance and it may be a healthy firm. The only exclusion is the ratio of cumulative profitability, due to its low predictive ability.(29)
Liquidity
Liquidity refers to meeting short-term liabilities in the normal course of business and working capital position is extensively used as a measure of short-term liquidity. Liquidity is one of the factors for the development of an international bankruptcy theory.(13) Its importance can be felt from the repercussions of the claimants when a firm is not able to meet its financial commitments. The study shows that distressed firms take much more time to convert their inventory to sales and return to cash.(28)
The liquidity ratio explains the short-term repayment capacity of the concern and it is showing liquidity capacity of the company.(47) When a firm has a sound liquidity position, it can pay off its short-term obligation in time. If the company has having adequate liquidity ratio and it can easily get rid of the possibility of financial distress, Liquidity affects predicting the financial distress of a firm.(41)
When the firm is in financial distress the currently accessible resources of liquid assets are severely insufficient to manage the current liabilities of its hard financial obligations. For managing financial distress situations, the top management may dispose off its fixed assets or non-current investments or renegotiate with the suppliers for extension credit and installment payment of dues, which may lead to the liquidation of the firm.(21)
Distress models
The initial work of financial modeling on an analysis of corporate financial distress is done(10,18) used accounting ratios are the foundation of their financial distress models and studies, but the approaches and selected financial ratios have been used differently and ultimately prediction models have improved and are more accurate in financial distress prediction. For measuring liquidity, solvency, profitability, and distress different models can be used and one of the methods is the Altman Z Score. The Altman Z ``‐Score model’s performance efficiency has been evaluated several times to get improved results.(4)
According to Karas et al.(35) in most countries and companies Altman’s financial distress prediction model is performing reasonably well and after the effect of the intercontinental financial crisis in the year 2008, several enterprises have been saved from financial distress, and this has increased the need for the betterment of financial distress prediction models. As per this study return on assets, inventory turnover ratio, and asset structures are important indicators for predicting corporate bankruptcy for all manufacturing and construction-based companies. Net working capital and working capital turnover ratios are special warning signals of financial distress or predictors for manufacturing companies.
Since 1968, it was found that numerous studies used the Altman model for the prediction of financial distress. However, the multiple discriminant analysis (MDA) techniques are strongly denounced because of their constructive hypothesis about multivariate normality and the independence of explanatory variables. To manage these shortcomings, with a set of nine finance and accounting ratios, Zavgren introduced a new model based on logit analysis. As a result, studies using logit analysis have been carried out and financial distress predictability has been improved.(11) For the warning of impending financial distress, more sophisticated techniques such as data analysis, hazard models or artificial intelligence have been used.(9,25)
A group of researchers examined the projection accuracies of cash, accrual, and mixed models for 33 failed and 33 non-failed industrial firms. The variables were collected by the researchers in an incremental fashion and from previous studies. As a result, the forecasting accuracy of the cash model has been shown to be superior to accrual-based models. In addition, the prediction accuracy of mixed models enhances classification compared to an accrual model and significant differences in forecast difference between different models are important.(37,38,45) For many decades the prediction of financial distress has been a significant and very interesting area for shareholders, lenders, government, investors, researchers, and employees.(17,20)
Altman EL et al.(3), mentioned that distress analysis is significant because most of the past studies dealt with larger corporations only, better predictability of bankruptcy for three years using Logit analysis and It was found that the study could predict bankruptcy with 96 %, 92 %, and 90 %, accuracy respectively for the first, second, and third years. They carried out a number of discriminant analyses that provided the best results. However, consistently good results were obtained from multiple discriminant analysis and linear probability. They found that the Logit probability model was more compatible than several methods for bankruptcy, and used them to compare it with economic distress theory. Lu Z et al.(26) used linear discriminant analysis and neural networks. They were of the opinion that discriminant analysis is superior to neural network analysis. For an explanation purposes, it is possible to find out which particular variables are of the greatest importance when discriminant analysis is performed. But with neural circuits that have irrational behavior patterns, it is not possible.
METHOD
This paper analyzes the probable chance of financial distress of a government company in India using the Rana S et al.(34), Zavgren’s Logit Probability(44), and the Fulmar model.(34) One of the most common and relevant areas of research in finance management has been predicting financial downturns. For companies, current and prospective investors as well as stock market regulators, it is important that they can anticipate the consequences of a downturn.(31)
Several bankruptcy prediction models have been used in the past century. Firstly, univariate analysis progressed to Multiple Discriminant Analysis, followed by the Logit Probability model analysis and Recursive Partitioning. Then, it was the turn of Algorithms, followed by Neural Networks. Beaver(10), was the first one to recognize that not all ratios predict equally. Since then, researchers have been constantly trying to determine the key predictive variables. Cielen(12) and Rose(39) found that single-ratio predictor tests could be misleading.
The data used for the analysis were gathered from the government manufacturing company. The primary data were obtained from discussions with officers and staff. The secondary data used were: - official records, information from the company website, company journals, and publications -including annual reports inclusive of financial statements for the period 2013-14 to 2018-19.
This study uses Multivariate financial distress models for performing financial distress analysis.In this study, Altman’s Z’ score, Logit Probability, and Falmur model were used for gauging the financial structure, liquidity, solvency, and profitability of the firm.
Logit Probability model
According to the Logit Probability model probability of distress is given following formula:
Probability of distress=(1/1+eʸ)
Where:
y=0,108(X1) +1,583(X2) +10,78(X3) +3,074(X4) +0,486(X5) +4,35(X6) 0,11(X7)
The X1 variable is inventory, the X2 variable is receivables, the X3 variable is cash and cash equivalents, the X4 variable is quick assets, the X5 variable is income earning, the X6 variable is leverage and the X7 variable is sales. The Logit model confines the possibility of default between 0 and 1 and corrects the distortion generated by the linear probability model. Only two values can be assigned to the explained variable: 0 for a stable firm and 1 for a firm that has achieved default.
Altman z-score model
The discriminant function estimated by Altman is as follows:
Z=0,012X1 + 0,014X2 + 0,033X3 + 0,006X4 + 0,999X5
The X1 variable is an Indicator of liquidity, the X2 variable is an Indicator of reinvestment of earnings, the X3 variable is an Indicator of profitability, the X4 variable is an Indicator of financial leverage and the X5 variable is an Indicator of sales generating capacity of the asset. the decision criteria are If the firm’s Z -Score is less than 1,81(Z<1,81) then it is considered a bankrupt firm. Z-Score lies between 1,81 and 2,99 (1,81<Z<2,99) are in the grey zone and if Z is greater than 2,89 (z>2,99) are healthy firms.
Fulmer H-Factor
According to the Fulmer H-Factor of distress is computed following formula:
H = 5,528(X1) + 0,212(X2) + 0,073(X3) + 1,270(X4) – 0,120(X5) +2,335(X6) + 0,575(X7) + 0,083(X8) + 0,894(X9) – 6,075
The X1 variable is the accumulated profit indicator, the X2 variable is the sales efficiency indicator, the X3 variable is the owner’s return indicator, the X4 variable is the operational cash flow indicator, the X5 Solvency indicator, the X6 Variable is the liquidity indicator, the X7 Variable is tangible asset indicator, the X8 variable is flowing capital indicator and the X9 Variable is debt service indicator. Fulmer model assesses criteria in which if H < 0 then the company is in a state of bankruptcy, while H > 0 means the company is in a healthy condition.
RESULTS
Altman’s multiple discriminant analysis
|
Table 1. X1 =Indicator of liquidity |
|
|
Year |
Indicator of liquidity |
|
2013-2014 |
0,40 |
|
2014-2015 |
0,37 |
|
2015-2016 |
0,40 |
|
2016-2017 |
0,39 |
|
2017-2018 |
0,08 |
|
2018-2019 |
-0,50 |
Table 1 shows the indicator of working capital to total assets, which exhibited the liquidity position of the firm.
|
Table 2. X2 =indicator of reinvestment of earnings |
|
|
Year |
Indicator of reinvestment of earning |
|
2013-2014 |
0,573 |
|
2014-2015 |
0,491 |
|
2015-2016 |
0,540 |
|
2016-2017 |
0,506 |
|
2017-2018 |
0,176 |
|
2018-2019 |
-0,609 |
Table 2 shows the relation between the retained earnings to the total assets. This is a measure of cumulative profitability for the period of the distress analysis. The indicator of reinvestment of earnings was not enough to sustain the business.
|
Table 3. X3 = Indicator of profitability |
|
|
Year |
Indicator of profitability |
|
2013-2014 |
0,137 |
|
2014-2015 |
0,117 |
|
2015-2016 |
0,611 |
|
2016-2017 |
0,170 |
|
2017-2018 |
-0,146 |
|
2018-2019 |
-0,365 |
Table 3 discloses the ratio of productivity of the company assets. The productivity of the company was not good for the period of analysis and this was due to inefficient management of assets.
|
Table 4. X4 = Indicator of financial leverage |
|
|
Year |
Indicator of financial leverage |
|
2013-2014 |
1,906 |
|
2014-2015 |
1,931 |
|
2015-2016 |
1,894 |
|
2016-2017 |
1,267 |
|
2017-2018 |
0,531 |
|
2018-2019 |
0,233 |
Table 4 shows the ratio of the market value of equity to total assets. This is explaining how the performance of assets was reflected in the market price of equity shares. The performance was very poor during the evaluation period.
|
Table 5. X5 = Indicator of sales generating capacity of assets |
|
|
Year |
Indicator of sales generating capacity of asset |
|
2013-2014 |
2,106 |
|
2014-2015 |
1,941 |
|
2015-2016 |
2,564 |
|
2016-2017 |
2,082 |
|
2017-2018 |
2,336 |
|
2018-2019 |
1,429 |
Table 5 shows the capital turnover ratio, this is to exhibit the revenue generation capacity of total investment assets. The performance was not up to level but it was satisfactory.
|
Table 6. Altman’s multiple discriminant analysis table |
||||||
|
Year |
X1,012 |
X2,014 |
X3,033 |
X4,006 |
X5,999 |
Z score |
|
2013-2014 |
0,0048 |
0,008022 |
0,004521 |
0,011436 |
2,103894 |
2,132673 |
|
2014-2015 |
0,00444 |
0,020131 |
0,003861 |
0,011586 |
1,939059 |
1,979077 |
|
2015-2016 |
0,0048 |
0,00756 |
0,020163 |
0,011364 |
2,561436 |
2,605323 |
|
2016-2017 |
0,00468 |
0,007084 |
0,00561 |
0,007584 |
2,079918 |
2,104876 |
|
2017-2018 |
0,00096 |
0,002464 |
-0,00482 |
0,003186 |
2,333664 |
2,335456 |
|
2018-2019 |
-0,006 |
-0,00853 |
-0,01205 |
0,001398 |
1,427571 |
1,402398 |
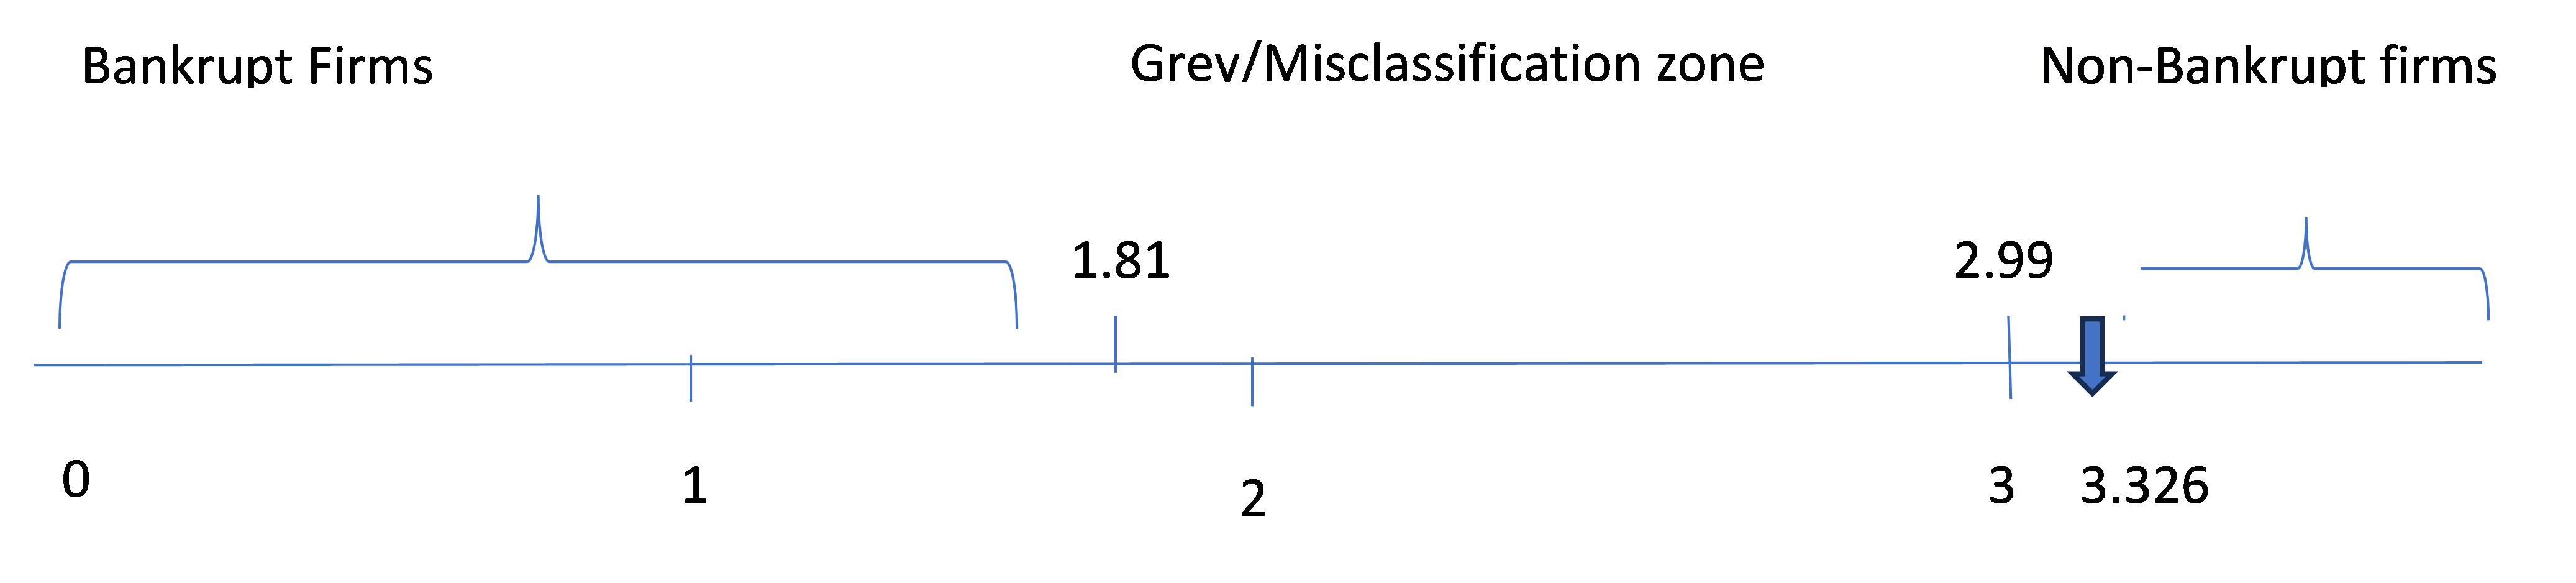
Figure 1.
Table 6 shows the Altman’s multiple discriminant analysis. Since the value of the Z score is between 1,81 and 2,99 in all years except 2018-2019, further analysis is required to identify the solvency position and financial distress in those years. But in the year 2018-2019, the firm scored 1,402 then it was a bankrupt firm according to Altman Z score evaluation.
Logit probability analysis
|
Table 7. X1=Inventory factor |
|
|
Year |
Inventory factor |
|
2013-2014 |
0,113 |
|
2014-2015 |
0,149 |
|
2015-2016 |
0,122 |
|
2016-2017 |
0,197 |
|
2017-2018 |
0,173 |
|
2018-2019 |
0,246 |
Table 7 shows the inventory to total assets factor. This factor was not showing well and had been affected by the level of working capital. It was increasing the chances of insolvency of the firm.
|
Table 8. X2=Receivable factor |
|
|
Year |
Receivable factor |
|
2013-2014 |
0,109 |
|
2014-2015 |
0,105 |
|
2015-2016 |
0,082 |
|
2016-2017 |
0,094 |
|
2017-2018 |
0,075 |
|
2018-2019 |
0,093 |
Table 8 shows the cash-to-total assets factor. This factor was not showing well and had been affected by liquidity, repayment capacity, and working capital position. This also explains the quality of liquidity maintained by the firm
|
Table 9. X3=Cash factor |
|
|
Year |
Cash factor |
|
2013-2014 |
0,016 |
|
2014-2015 |
0,005 |
|
2015-2016 |
0,011 |
|
2016-2017 |
0,014 |
|
2017-2018 |
0,005 |
|
2018-2019 |
0,002 |
Table 9 shows the cash and marketable security to the total assets factor. As per the analysis, this factor was very weak and there was a deficiency of cash and cash equivalents and marketable securities, this was contributing to the issues of repayment of loans and meeting daily expenses.
|
Table 10. X4=Liquid asset factor |
|
|
Year |
Liquid asset factor |
|
2013-2014 |
1,649 |
|
2014-2015 |
1,287 |
|
2015-2016 |
1,111 |
|
2016-2017 |
0,900 |
|
2017-2018 |
0,621 |
|
2018-2019 |
0,195 |
Table 10 explains the Liquidity assets factor analysis is explaining the total liquidity affected by the company. The rule of thumb for the proportion of quick assets factor is 1:1. this has been showing inadequate investment quick assets with current liabilities.
|
Table 11. X5=Income factor |
|
|
Year |
Income factor |
|
2013-2014 |
0,172 |
|
2014-2015 |
0,158 |
|
2015-2016 |
0,851 |
|
2016-2017 |
0,237 |
|
2017-2018 |
-0,333 |
|
2018-2019 |
-4,590 |
Table 11 explains the income factor analysis was not favorable to the company, this analysis revealed the return-on-investment ratio has not been adequate for the sustainability of the company in the industry. From this income factor analysis, the incomes earned were not enough to cover the expenses for the successful running of the business.
|
Table 12. X6=Leverage factor |
|
|
Year |
Leverage factor |
|
2013-2014 |
0,072 |
|
2014-2015 |
0,107 |
|
2015-2016 |
0,043 |
|
2016-2017 |
0,070 |
|
2017-2018 |
0,147 |
|
2018-2019 |
-3,444 |
Table 12 explains the relationship between the long-term debt to capital employed during the period of the study. In the first five years debt source of financing was not adequate and last year it was more and not favorable to the company and the factor turned negative due to the excess borrowing over the total asset.
|
Table 13. X7=Sales factor |
|
|
Year |
Sales factor |
|
2013-2014 |
2,106 |
|
2014-2015 |
1,941 |
|
2015-2016 |
2,564 |
|
2016-2017 |
2,082 |
|
2017-2018 |
2,336 |
|
2018-2019 |
1,515 |
Table 13 shows the impact of the sales factor on the financial health and this factor was not up to the mark for sustaining the company in the industry. This factor was inconsistent for the period of study due disproportionate generation of income with the amount invested in the fixed and current assets.
|
Table 14. Explains the different financial variables |
||||||||||
|
Year |
0,108X1 |
1,583X2 |
10,78X3 |
3,074X4 |
0,486X5 |
4,35X6 |
0,11X7 |
Y |
eʸ |
1+eʸ |
|
2013-2014 |
0,012204 |
0,17254 |
0,17248 |
5,06902 |
0,08359 |
0,31320 |
0,23166 |
4,952677 |
141,5534 |
142,55340 |
|
2014-2015 |
0,016092 |
0,16621 |
0,05390 |
3,95623 |
0,07678 |
0,46545 |
0,21351 |
3,783709 |
43,97886 |
44,978860 |
|
2015-2016 |
0,013176 |
0,12980 |
0,11858 |
3,41521 |
0,41358 |
0,18705 |
0,28204 |
3,901058 |
49,45474 |
50,454740 |
|
2016-2017 |
0,021276 |
0,14880 |
0,15092 |
2,76660 |
0,11518 |
0,30450 |
0,22902 |
2,724134 |
15,24321 |
16,243210 |
|
2017-2018 |
0,018684 |
0,118725 |
0,05390 |
1,90895 |
0,16184 |
0,63945 |
0,25696 |
1,412147 |
4,104759 |
5,1047590 |
|
2018-2019 |
0,026568 |
0,14721 |
0,02156 |
0,59943 |
2,23074 |
14,9814 |
0,16665 |
13,56022 |
774 693,7 |
774 694,70 |
Logit probability analysis table
The value derived from the above table no 14 explains the different financial variables that create the probability of bankruptcy and financial distress status. From the table, the chances of bankruptcy were very high during the period of study especially in the last year, hence this company may go into liquidation shortly.
Fulmar model
|
Table 15. X1 = Accumulated profit indicator |
|
|
Year |
Accumulated profit indicator |
|
2013-2014 |
0,573 |
|
2014-2015 |
0,491 |
|
2015-2016 |
0,540 |
|
2016-2017 |
0,506 |
|
2017-2018 |
0,176 |
|
2018-2019 |
-0,609 |
Table 15 shows the accumulated profit to total assets. This is a measure of cumulative profitability over the life of the company. The indicator was showing only less proportion of accumulated profit to the total assets, which means the company was not having enough profit to finance its future requirement.
|
Table 16. X2 = Sales efficiency indicator |
|
|
Year |
Sales efficiency indicator |
|
2013-2014 |
2,106 |
|
2014-2015 |
1,941 |
|
2015-2016 |
2,564 |
|
2016-2017 |
2,082 |
|
2017-2018 |
2,336 |
|
2018-2019 |
1,515 |
Table 16 shows the sales efficiency factor and this factor was how the invested capital generated incomes for the period of study. The generation of income was not adequate to cover the business expenses and return on capital employed.
|
Table 17. X3 = Owners return indicator |
|
|
Year |
Owners return indicator |
|
2013-2014 |
0,029 |
|
2014-2015 |
0,021 |
|
2015-2016 |
0,167 |
|
2016-2017 |
0,032 |
|
2017-2018 |
-0,047 |
|
2018-2019 |
-0,099 |
Table 17 shows the owner’s return indicator explains the return to equity shareholders’ investment in the business. As per the indicator factors from the above table shows rerun does not cover shareholders’ desirable return on their investment.
|
Table 18. X4 = Operational cash flow indicator |
|
|
Year |
Operational cash flow indicator |
|
2013-2014 |
0,452 |
|
2014-2015 |
0,516 |
|
2015-2016 |
1,862 |
|
2016-2017 |
0,776 |
|
2017-2018 |
0,470 |
|
2018-2019 |
0,275 |
Table 18 shows the ratio of operating cash flow indicator, this factor shows total cash flows to total liability payable. As per the table, total cash inflows were not enough to cover total external liability payments for the period of study. This was one of the factors the firm is treated as a bankrupt firm.
|
Table 19. X5=Solvency indicator |
|
|
Year |
Solvency indicator |
|
2013-2014 |
0,263 |
|
2014-2015 |
0,338 |
|
2015-2016 |
0,312 |
|
2016-2017 |
0,333 |
|
2017-2018 |
0,626 |
|
2018-2019 |
1,353 |
Table 19 explains solvency factor analysis, that is the total external liability to total assets for the period of study. The factor was not satisfactory for the evaluation period, it means the solvency of the firm was treacherous. This was one reason for enhancing the chances of bankruptcy.
|
Table 20. X6 = Liquidity indicator |
|
|
Year |
Liquidity indicator |
|
2013-2014 |
0,206 |
|
2014-2015 |
0,259 |
|
2015-2016 |
0,281 |
|
2016-2017 |
0,282 |
|
2017-2018 |
0,561 |
|
2018-2019 |
1,080 |
Table 20 shows the liquidity indicator, that is total current liability to the total assets. This indicator was not up to the standard for maintaining adequate liquidity for the period of study. This was one leading signal for the chances of insolvency of firms and this was due to disproportionate growth in the current liability and current assets. Hence the probability of technical insolvency was very high for the last two years.
|
Table 21. X7=Tangible asset indicator |
|
|
Year |
Logarithm |
|
2013-2014 |
8,901360065 |
|
2014-2015 |
8,857046958 |
|
2015-2016 |
8,858388591 |
|
2016-2017 |
8,806856393 |
|
2017-2018 |
8,755112621 |
|
2018-2019 |
8,725833291 |
Table 21 indicates the tangible assets factor of the firm during the period of study. This had been calculated with the help of a logarithm of tangible assets, as per the calculation this was not enough to maintain the good health condition of the business.
|
Table 22. X8=Flowing capital indicator |
|
|
Year |
Flowing capital indicator |
|
2013-2014 |
1,529 |
|
2014-2015 |
1,104 |
|
2015-2016 |
1,281 |
|
2016-2017 |
1,166 |
|
2017-2018 |
0,130 |
|
2018-2019 |
-0,372 |
Table 22 shows the flowing capital to total asset indicator. This indicator shows the working capital base of the firm was not sufficient to run a business successfully. This was due to the growth of short-term assets and liabilities out of proportion for the period of study.
|
Table 23. X9=debt service indicator |
|
|
Year |
Debt service indicator |
|
2013-2014 |
2,949617294 |
|
2014-2015 |
2,379356042 |
|
2015-2016 |
16,55773675 |
|
2016-2017 |
3,802872723 |
|
2017-2018 |
-2,13717361 |
|
2018-2019 |
-2,231911535 |
Table 23 shows the debt service indicator. This is the logarithm before interest and tax to interest cost. This ratio indicates the interest payment capacity of the company. As the evaluation factor was not good for protecting the interest of the debt owners, this may attract the chances of insolvency of the firm.
|
Table 24. Fulmar model evaluation table |
|||||||||||
|
Year |
5,52X1 |
0,212X2 |
0,073X3 |
1,27X4 |
0,12X5 |
2,335X6 |
0,575X7 |
1,082X8 |
0,894X9 |
6,075 |
F |
|
2013-2014 |
3,16296 |
0,446472 |
0,002117 |
0,57404 |
0,03156 |
0,48101 |
5,1182820 |
1,654378 |
2,63696 |
6,075 |
7,969657 |
|
2014-2015 |
2,71032 |
0,411492 |
0,0015 |
0,65532 |
0,04056 |
0,604765 |
5,0928020 |
1,194528 |
2,12714 |
6,075 |
6,682344 |
|
2015-2016 |
2,9808 |
0,543568 |
0,012191 |
2,36474 |
0,03744 |
0,656135 |
5,09357344 |
1,386042 |
14,8026 |
6,075 |
21,72723 |
|
2016-2017 |
2,79312 |
0,441384 |
0,002336 |
0,98552 |
0,03996 |
0,65847 |
5,06394242 |
1,261612 |
3,39977 |
6,075 |
8,491193 |
|
2017-2018 |
0,97152 |
0,495232 |
-0,003431 |
0,5969 |
0,07512 |
1,309935 |
5,03418975 |
0,14066 |
-1,9106 |
6,075 |
0,484253 |
|
2018-2019 |
-3,36168 |
0,32118 |
-0,007227 |
0,34925 |
0,16236 |
2,5218 |
5,01735414 |
-0,402504 |
-1,9953 |
6,075 |
-3,79452 |
Table 24 shows the probability value of the firm for categorizing them as a bankrupt firm. Initial the period of the study showed probability value of F<0 was greater than 0 but during the period 2018-2019 probability value of F<0 was less than 0 hence the firm may go the liquidation in near future.
CONCLUSIONS
The predetermination of financial distress is an area that has invited the attention of different parties like shareholders, government, money lenders, investors, suppliers, researchers, and the general public. Even though the forecasting of financial distress has been studied by numerous researchers for a long period, a perfect tool, a financial model and financial ratios have not been finalized yet. For the analyzing data Altman Z score, Logit Probability, and Fulmar model were used for testing the financial distress in the government company for the period 2013-14 to 2018-19, as per Fulmer analysis the corporation was classified as a bankrupt firm due to the F value is less than 0 for the year 2018-19, The result of Logit Probability also was showing the chances of insolvencies in 2018-19. Since the value of the Z score lies between 1.81 and 2.99 in all years except 2018-2019, further analysis is required to identify the solvency position in those years. But in the year 2018-2019, the firm scored 1.402 then it is a bankrupt firm. I used variables of accumulated profit indicator, sales efficiency indicator, owners return indicator, operational cash flow indicator, Solvency indicator, liquidity indicator, tangible asset indicator, flowing capital indicator, and debt service indicator. Our study’s outcomes show that depending on financial models including accounting ratios, multivariate, and rather than relying solely on the accounting data or information financial statements, macroeconomic ratios provide a more detailed explanation and forecast of financial distress.
Also, it indicates that the most predominant variables which should be contemplated by researchers in future research are: inventory turnover ratio (average inventory by sales), Receivables turnover ratio (Sales by Average Receivables), cash, and marketable securities by total assets ratio, Quick ratio (Quick Assets by Current Liabilities), Return on Capital Employed (Income from Continuing Operations by Capital Employed), long term debt by capital employed(Proportion of external debt), sales by net assets capital and fixed assets. total debt by total assets, Net income margin (Net Income by Sales), Net interest margin (Net Interest Income by Total Assets), Working capital ratio (Working Capital by Total Assets), Solvency ratio, long-term debt by total assets, quick assets by total assets, current assets by total assets, Current assets turnover ratio (current assets by sales), Quick assets turnover ratio(quick assets by sales), total liabilities by working capital ratio, total debt by working capital ratio, Net worth turnover ratio (net worth by sales), Working capital turnover ratio (sales by working capital), Receivables turnover ratio (receivables by sales), Interest coverage ratio (interest by sales), Total assets turnover ratio(sales to total assets), and Interest coverage ratio (interest by working capital). Also, market test ratios such as Price-to-Earnings (P E ratio), dividend yield ratio, earning per share ratio, market value to book value, and interest.
The findings of this research have some practical and theoretical implications. First, this research outcome will be helpful to the top management of any firm in reviving sick units into healthy units. Second, the Government can take appropriate actions and financial aid for the recovery of financially distressed government companies. Third, the managers and top officials of other public and private organizations can identify the early syndromes of financial distress and can plan necessary actions for recovery. Fourth, this research highlights the main electromotive force behind financial distress which is vital information for policymakers and statutory authorities. Adopting the same comprehensive model in different Indian sectors could be executed in future research.
BIBLIOGRAPHIC REFERENCES
1. Altman EI. Financial ratios, discriminant analysis and the prediction of corporate bankruptcy. The journal of finance. 1968 Sep 1; 23(4): 589-609. https://doi.org/10.2307/2978933
2. Altman EI, Hotchkiss E. Corporate financial distress and bankruptcy. New York: John Wiley & Sons; 1993. http://ci.nii.ac.jp/ncid/BA20382005
3. Altman EI, Marco G, Varetto F. Corporate distress diagnosis: Comparisons using linear discriminant analysis and neural networks (the Italian experience). Journal of banking & finance. 1994 May 1; 18(3): 505-529. https://doi.org/10.1016/0378-4266(94)90007-8
4. Altman EI, Iwanicz‐Drozdowska M, Laitinen EK, Suvas A. Financial distress prediction in an international context: A review and empirical analysis of Altman’s Z‐score model. Journal of international financial management & accounting. 2017 Jun; 28(2): 131-171. https://doi.org/10.1111/jifm.12053
5. Amendola A, Restaino M, Sensini L. An analysis of the determinants of financial distress in Italy: A competing risks approach. International Review of Economics & Finance. 2015 May 1; 37: 33-41. https://doi.org/10.1016/j.iref.2014.10.012
6. Ananto RP, Mustika R, Handayani D. The influence of good corporate governance (GCG), leverage, profitability and company size on financial distress in consumer goods companies listed on the Indonesian Stock Exchange. Dharma Andalas Journal of Economics and Business. 2017 Mar 7; 19(1): 92.
7. Arnold G. Corporate Financial Management (2nd Edition ed.). Pearson Education Limited. 2007. http://ci.nii.ac.jp/ncid/BA8072774X
8. Udayakumar R, Chowdary PB, Devi T, Sugumar R. Integrated SVM-FFNN for Fraud Detection in Banking Financial Transactions. Journal of Internet Services and Information Security. 2023; 13(3): 12-25.
9. Balcaen S, Ooghe H. 35 years of studies on business failure: an overview of the classic statistical methodologies and their related problems. The British Accounting Review. 2006 Mar 1; 38(1): 63-93. https://doi.org/10.1016/j.bar.2005.09.001
10. Beaver WH. Financial ratios as predictors of failure. Journal of accounting research. 1966 Jan 1: 71-111. https://doi.org/10.2307/2490171
11. Campbell JY, Hilscher J, Szilagyi J. In search of distress risk. The Journal of finance. 2008 Dec; 63(6): 2899-2939. https://doi.org/10.1111/j.1540-6261.2008.01416.x
12. Cielen A, Peeters L, Vanhoof K. Bankruptcy prediction using a data envelopment analysis. European Journal of Operational Research. 2004 Apr 16; 154(2): 526-532. https://doi.org/10.1016/s0377-2217(03)00186-3
13. Du Jardin P. Bankruptcy prediction using terminal failure processes. European Journal of Operational Research. 2015 Apr 1; 242(1): 286-303. https://doi.org/10.1016/j.ejor.2014.09.059
14. Edmister RO. An empirical test of financial ratio analysis for small business failure prediction. Journal of Financial and Quantitative analysis. 1972 Mar; 7(2): 1477-1493. https://doi.org/10.2307/2329929
15. Fathi MR, Rahimi H, Minouei M. Predicting financial distress using the worst-practice-frontier data envelopment analysis model and artificial neural network. Nankai Business Review International. 2023 Jun 5; 14(2): 295-315. https://doi.org/10.1108/nbri-01-2022-0005
16. Foster G. Financial Statement Analysis (2nd ed.) [English]. Prentice-Hall, Englewood Cliffs. 1986.
17. Geng R, Bose I, Chen X. Prediction of financial distress: An empirical study of listed Chinese companies using data mining. European Journal of Operational Research. 2015 Feb 16; 241(1): 236-247. https://doi.org/10.1016/j.ejor.2014.08.016
18. Bellovary JL, Giacomino DE, Akers MD. A review of bankruptcy prediction studies: 1930 to present. Journal of Financial education. 2007 Dec 1: 1-42. https://epublications.marquette.edu/account_fac/25/
19. Halteh K, Tiwari M. Preempting fraud: a financial distress prediction perspective on combating financial crime. Journal of Money Laundering Control. 2023 Nov 28; 26(6): 1194-1202. https://doi.org/10.1108/jmlc-01-2023-0013
20. Jabeur SB. Bankruptcy prediction using partial least squares logistic regression. Journal of Retailing and Consumer Services. 2017 May 1; 36: 197-202. https://doi.org/10.1016/j.jretconser.2017.02.005
21. John TA. Accounting measures of corporate liquidity, leverage, and costs of financial distress. Financial management. 1993 Oct 1: 91-100.
22. Kashyap S, Bansal R. Modeling Financial Distress Prediction of Indian Companies. International Journal of Recent Technology and Engineering (IJRTE). 2019; 8(1C2).
23. Konstantaras K, Siriopoulos C. Estimating financial distress with a dynamic model: Evidence from family owned enterprises in a small open economy. Journal of Multinational Financial Management. 2011 Oct 1; 21(4): 239-255. https://doi.org/10.1016/j.mulfin.2011.04.001
24. Korol T. Early warning models against bankruptcy risk for Central European and Latin American enterprises. Economic Modelling. 2013 Mar 1; 31: 22-30. https://doi.org/10.1016/j.econmod.2012.11.017
25. Kumar PR, Ravi V. Bankruptcy prediction in banks and firms via statistical and intelligent techniques–A review. European journal of operational research. 2007 Jul 1; 180(1): 1-28. https://doi.org/10.1016/j.ejor.2006.08.043
26. Lu Z, Zhuo Z. Modelling of Chinese corporate bond default–A machine learning approach. Accounting & Finance. 2021 Dec; 61(5): 6147-6191. https://doi.org/10.1111/acfi.12846
27. Lütz S, Kranke M. The European rescue of the Washington Consensus? EU and IMF lending to Central and Eastern European countries. Review of International Political Economy. 2014 Mar 4; 21(2): 310-338. https://doi.org/10.1080/09692290.2012.747104
28. Mohamed SS. Suggested model for explaining financial distress in Egypt: Toward a comprehensive model. In Financial Issues in Emerging Economies: Special Issue Including Selected Papers from II International Conference on Economics and Finance, Bengaluru, India). Emerald Publishing Limited. (https://doi.org/10.1108/S0196-382120200000036005). 2020 Nov 10; 36: 99-122.
29. Muñoz-Izquierdo N, Segovia-Vargas MJ, Pascual-Ezama D. Explaining the causes of business failure using audit report disclosures. Journal of Business Research. 2019 May 1; 98: 403-414. https://doi.org/10.1016/j.jbusres.2018.07.024
30. Friday JE, Godfrey VZ. Perception of and Attitude to Marketing of Library and Information Products and Services by Librarians in Public University Libraries in Bayelsa and Rivers States of Nigeria. Indian Journal of Information Sources and Services. 2023; 13(1): 39–48.
31. Alifiah MN. Prediction of financial distress companies in the trading and services sector in Malaysia using macroeconomic variables. Procedia-Social and Behavioral Sciences. 2014 May 15; 129: 90-98.
32. Platt HD, Platt MB. Predicting corporate financial distress: Reflections on choice-based sample bias. Journal of economics and finance. 2002 Jun; 26(2): 184-199. https://doi.org/10.1007/bf02755985
33. Plumley D, Serbera JP, Wilson R. Too big to fail? Accounting for predictions of financial distress in English professional football clubs. Journal of Applied Accounting Research. 2021 Jan 25; 22(1): 93-113. https://doi.org/10.1108/jaar-05-2020-0095
34. Rana S, Mahmud A, Mawa Z. A Study of the Applicability of Bankruptcy Prediction Models: An Empirical Analysis of Steel Manufacturing Companies of Bangladesh. Emperor International Journal of Finance and Management Research. 2020; 6: 1-22.
35. Karas M, Režňáková M. The stability of bankruptcy predictors in the construction and manufacturing industries at various times before bankruptcy. E+M. Ekonomie a Management. 2017; 20(2): 116–133. https://doi.org/10.15240/tul/001/2017-2-009
36. Rohmadini A, Saifi M, Darmawan A. The influence of profitability, liquidity and leverage on financial distress (Study of food & beverage companies listed on the Indonesia Stock Exchange for the 2013-2016 period). Journal of Business Administration. 2018; 61(2): 11-9.
37. Rujoub MA, Cook DM, Hay LE. Using cash flow ratios to predict business failures. Journal of Managerial Issues. 1995 Apr 1: 75-90. https://www.jstor.org/stable/40604051
38. Camgözlü Y, Kutlu Y. Leaf Image Classification Based on Pre-trained Convolutional Neural Network Models. Natural and Engineering Sciences. 2023 Dec 1; 8(3): 214-232.
39. Rose PS, Giroux GA. Predicting corporate bankruptcy: an analytical and empirical evaluation. Review of Financial Economics. 1984 Apr 1; 19(2): 1–12.
40. Tanja M, Milica V. The Impact of Public Events on the Use of Space: Analysis of the Manifestations in Liberty Square in Novi Sad. Arhiv za tehničke nauke, 2023; 2(29): 75-82.
41. Simanjuntak CE, Krist FT, Aminah W. The Influence of Financial Ratios on Financial Distress. eProceedings of Management. 2017 Aug 1; 4(2). https://libraryeproceeding.telkomuniversity.ac.id/index.php/management/article/view/1411
42. Tandon D, Tandon N. Credit Default Analytics in Banks Using Altman Z score. BULMIM Journal of Management and Research. 2016; 1(1): 1-1. https://doi.org/10.5958/2455-3298.2016.00001.5
43. Tykvova T, Borell M. Do private equity owners increase risk of financial distress and bankruptcy? Journal of Corporate Finance, 2012; 18(1): 138–150. https://doi.org/10.1016/j.jcorpfin.2011.11.004
44. Muparuri L, Gumbo V. On logit and artificial neural networks in corporate distress modelling for Zimbabwe listed corporates. Sustainability Analytics and Modeling. 2022 Jan 1; 2: 100006. https://doi.org/10.1016/j.samod.2022.100006
45. Srinadi NL, Hermawan D, Jaya AA. Advancement of banking and financial services employing artificial intelligence and the internet of things. Journal of Wireless Mobile Networks, Ubiquitous Computing, and Dependable Applications. 2023; 14(1): 106-117.
46. Sari A, Saputra H, Siahaan AP. Financial distress analysis on Indonesia stock exchange companies. International journal for innovative research in multidisciplinary field. 2018; 4(3): 73-74.
47. S E, K. (2012). Analysis of financial statements. Raja Grafindo.
48. Asutay M, Othman J. Alternative measures for predicting financial distress in the case of Malaysian Islamic banks: assessing the impact of global financial crisis. Journal of Islamic Accounting and Business Research. 2020 Dec 6; 11(9): 1827-1845. https://doi.org/10.1108/jiabr-12-2019-0223
FINANCING
No financing for the article.
CONFLICT OF INTEREST
The author declares that there is no conflict of interest in the work.
AUTHORSHIP CONTRIBUTION
Conceptualization: A.V. Rejimon, M. Usha.
Data curation: A.V. Rejimon, M. Usha.
Formal analysis: A.V. Rejimon, M. Usha.
Research: A.V. Rejimon, M. Usha.
Methodology: A.V. Rejimon, M. Usha.
Drafting - original draft: A.V. Rejimon, M. Usha.
Writing - proofreading and editing: A.V. Rejimon, M. Usha.