Category: STEM (Science, Technology, Engineering and Mathematics)
REPORTE DE CASO
Sizing Of Photovoltaic Standalone System In Mandali City / Iraq: A Case Study
Dimensionamiento de un sistema fotovoltaico autónomo en la ciudad de Mandali (Iraq): Un estudio de caso
Shaima Mahmoud Dhiyab Al-Janabi1 *, Fadhel A. Jumaa1 *
1Electrical Engineering Techniques Department, Technical College /Al-Mussaib, Al-Furat Al-Awsat Technical University
Cite as: Mahmoud Dhiyab Al-Janabi S, Jumaa FA. Sizing Of Photovoltaic Standalone System In Mandali City / Iraq: A Case Study. Salud, Ciencia y Tecnología - Serie de Conferencias. 2024; 3:835. https://doi.org/10.56294/sctconf2024835
Submitted: 25-01-2024 Revised: 05-04-2024 Accepted: 02-06-2024 Published: 03-06-2024
Editor: Dr.
William Castillo-González ![]()
Note: paper presented at the 3rd Annual International Conference on Information & Sciences (AICIS’23).
ABSTRACT
This paper includes a study on the load requirements of houses located in Mandali city, Iraq, as well as design and installation of a stand-alone photovoltaic (PV) system. The utilization of PVsyst simulation software has facilitated the examination of performance ratio with losses. The mean annual energy demand within the residential dwelling is recorded as 4 614,5 kilowatt-hours per year, while the solar panel system is capable of generating 5 731,6 kilowatt-hours per year. However, the energy delivered to the user falls slightly short of the required load, amounting to 4 614,5 kilowatt-hours per year. The diminished power capacity for the system can be attributed to many types of losses. The examination of performance ratios indicates that the month of November exhibited the highest performance ratio (PR) at 87,57 %, while the lowest PR of 50,61 % was seen in April. On average, the PR for the entire year was calculated to be 63 %. The diminished power capacity for the system can be attributed to many types of losses.
Keywords: Performance Ratio; Photovoltaic Sizing; Stand-Slone System; Mandali Photovoltaic Sizing.
RESUMEN
Este trabajo incluye un estudio sobre los requisitos de carga de las viviendas situadas en la ciudad de Mandali, Irak, así como el diseño y la instalación de un sistema fotovoltaico (FV) autónomo. La utilización del software de simulación PVsyst ha facilitado el examen del coeficiente de rendimiento con pérdidas. La demanda media anual de energía de la vivienda residencial es de 4 614,5 kilovatios-hora al año, mientras que el sistema de paneles solares es capaz de generar 5 731,6 kilovatios-hora al año. Sin embargo, la energía suministrada al usuario es ligeramente inferior a la carga necesaria, que asciende a 4 614,5 kilovatios-hora al año. La disminución de la capacidad energética del sistema puede atribuirse a muchos tipos de pérdidas. El examen de los ratios de rendimiento indica que el mes de noviembre presentó el mayor ratio de rendimiento (PR), con un 87,57 %, mientras que el PR más bajo, del 50,61 %, se observó en abril. En promedio, el PR para todo el año se calculó en un 63 %. La disminución de la capacidad energética del sistema puede atribuirse a varios tipos de pérdidas.
Palabras clave: Coeficiente de Rendimiento; Dimensionamiento Fotovoltaico; Sistema Aislado; Dimensionamiento Fotovoltaico Mandali.
INTRODUCTION
The main concerns of the twenty-first century are decarbonizing the energy sector and reducing carbon emissions to restrain environmental change. More than 90 % of the reduction in CO2 emissions anticipated by 2 050 will be provided by renewable energy and efficiency improvements, complemented by fast electrification.(1,2) The sun supplies the energy required to maintain life in our solar system. The Earth receives from the sun enough energy in a single hour to meet all of its needs for more than a year. (3,4) According to recent research, renewable energy has enormous potential and can be used to meet global energy needs. Since PV technology has a number of advantages, including low maintenance requirements, an endless supply of free energy, and sturdy and long-lasting system(5) However, due to nature's unpredictability, dependency on the weather, and variations in climate, solar radiation varies and constantly changes, making solar energy unreliable at times. As a result, generated energy and load demand are not always equal.
The primary source of energy for photovoltaic systems is the sun radiation present at the location. A brief description of the three main types of PV systems is given: stand-alone, grid-connected, and hybrid. These systems take various load profiles and available solar radiation levels into account.(6) Since Iraq is situated in Asia, south of the Equator, in the northern hemisphere. While it is cloudier in the north, the weather is nearly always sunny in the south and center of Iraq. Iraq's middle and southern regions are thought to have some of the world's highest sun radiation levels. With an average of 170 W/m2, the west of Iraq has the highest sun irradiation of any location, making it the ideal area for using solar electricity for pregnancy.
The annual cumulative universal radiation in Baghdad is (80Wh/m2). Several studies like in(7) Due to its highly unique location near the sun, Iraq receives up to 7 kWh/m2 of solar radiation annually, with sunshine falling between 2 800 and 3 300 hours per year the maximum sunshine duration occurs in June, measuring approximately 11,4 hours per day.(8)
The location, weather, and amount of solar irradiation are the crucial factors that influence a PV system's performance. Consequently, in order to attain optimal performance from PV systems, high cell conversion efficiency is required, (9) as is utility Maximum Power Point Tracking (MPPT) control(10,11) and the installation of PV panels on solar tracking systems to track the sun's path during the day and thereby boost efficiency.(12,13) In addition, they store energy to generate electricity in the absence of sunshine. Thus, high bank storage capacity batteries that meet the required power consumption.(14,15) that influence a PV system's capacity to generate power, it is imperative to research or examine these variables. Although analysis can be done by hand, technological advancements have made it possible to create a variety of As a result, in order to learn more about the attributes simulation programs, including PV Planner, Homer Pro, PVsyst, and others. It has been demonstrated that this software is quick and sophisticated.(16,17,18,19,20,21)
This study aims to design a stand-alone photovoltaic (PV) system and evaluate the performance ratio for each month of the year in a particular region. Additionally, it aims to provide an overview of the simulation of standalone PV systems.
An important aspect of constructing a stand-alone system system is determining the performance ratio for each month. This ratio directly influences energy output and aids in determining the necessary storage capacity.
The second section presents the arrangement of an independent photovoltaic (PV) system. The third section entails the mathematical methodology for determining the appropriate size of the photovoltaic (PV) system. The simulation method is the fourth section. The PVsyst software generates data for one year, including information on solar radiation based on the latitude and longitude of the site. It calculates the optimum tilt angle for the solar panel and provides various values for solar energy generation based on the specified load and the design of the PV system. Additionally, it provides technical specifications for the components used in the PV system. Subsequently, the system's simulation results are executed. Finally, the last segment comprises the conclusions of the study.
Configuration of stand-alone pv system
The stand-alone photovoltaic (PV) system is a self-sufficient system utilized for supplying electricity to loads situated in regions that are distant from grid distribution lines, as mentioned in a remote setting.(22) Figure 1 illustrates the various components of a stand-alone photovoltaic (PV) system, as referenced in source.(23) The primary constituents of the stand-alone photovoltaic (PV) system encompass the PV panel, batteries, charge controller, and inverter.(24) Tilted photovoltaic (PV) panels catch sunlight and then transform it into electrical energy. Subsequently, the generated electrical energy is regulated by the utilization of a charge controller. Excess electricity generated beyond the immediate need may be effectively stored in batteries, serving as a backup power source during periods of limited solar availability, such as nighttime or overcast weather conditions. The inverter is responsible for converting the direct current (DC) electricity generated by the panels into alternating current (AC) to power the AC loads.(23)
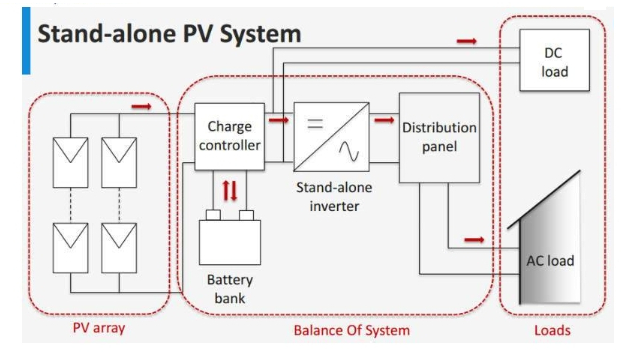
Figure 1. Stand-Alone PV System Configuration
Mathmatical pv system sizing
However, it cannot produce enough electricity to power medium- and large-sized energy loads. A series connection of solar cell panels is necessary to obtain the voltages needed for loads, while a parallel connection is necessary to achieve the necessary current. However, the solar panel is made up of several PV cells that are connected in parallel and series, the following details must be ascertained before beginning to compute the quantity of series and parallel solar cell panels
• The DC voltage of the system (Vdc).
• The daily average number of sun hours (Tsh).
• The watt-hour (Ed) average daily energy demand
Finding the average daily energy demand (Ed) is the first step in figuring out how many solar panels to install. This can be done by dividing the average daily demand by the sum of the efficiencies of all the system's components, as shown in equation 1 below:(25,26)
![]()
Where nb = battery efficiency
Ni= inverter efficiency
Nc= charge controller efficiency
The required daily average energy demand is then divided by the average number of sun hours per day (Tsh) at the location to determine the average peak power (Pave, peak) as follows:
![]()
By dividing the average peak power by the system dc voltage, one may find the system dc current (𝐼𝑑𝑐) as follows:
![]()
The system dc voltage is then divided by each module's rated voltage (Vrm) to determine the number of modules in series (Nsm) as follows
![]()
The parallel number of module strings (Npm) was calculated by dividing the system's total dc current by the module has rated current (Irm). The result was as follows:
![]()
Finally, by multiplying the number of modules in series by the number of parallel modules as in equation (6), the total number of modules (Ntm) that make up the array is found, providing the necessary array size.
![]()
Deep cycle batteries are required for solar systems in order to allow for rapid charging and discharging over an extended period of time. High storage capacities of batteries are necessary to guarantee that all loads are run on wet, cloudy, and nighttime days. The quantity of estimated energy storage (Eest), which is equal to the product of the daily average energy consumption and the number of autonomous days (Daut), must be determined before determining the necessary battery capacity, as shown below.(27)
![]()
Next, a safe energy storage (Esafe) is calculated by dividing the predicted energy storage by the maximum depth of discharge that is permitted (Ddisch), as indicated by
![]()
One battery's (Vb) dc voltage is divided by the safe energy storage to find the overall capacity of the battery bank employed in ampere hours (Ctb).
![]()
As demonstrated below, the total number of batteries (Ntb) can be computed by dividing the total ampere-hour capacity of the batteries bank used by the capacity of a single battery in ampere-hours (Cb):
![]()
Now, the number of batteries in series (Nsb) may be calculated by dividing the DC voltage of the system by the DC voltage rating of a single battery, as follows:
![]()
By dividing the total number of batteries (Ntb) by the series number of batteries, one can determine the number of parallel battery strings (Npb) as follows:
![]()
The primary purpose of the solar charge controller unit is to maintain a match between the voltages produced by the solar cells and the load voltage by controlling both the current values of the solar cells and the total current value of the load. The ability of the solar charge controller unit to tolerate the array's total short circuit current (ISCA=IscM×Npm) and a specific safe factor (Fsafe) is the most crucial aspect in defining the unit's capacity. A reasonable system expansion is made possible by the presence of the safe factor. Thus, the following formula yields the appropriate charge controller current (Icc):
![]()
Simulation Method
PVsyst use in this research is one of the most widely used simulation programs available today. The Swiss scientist Andre Mermaid and his company created it. Most engineers across the world use it because of how quickly it produces results and how convenient it is. It analyzes several factors that have a role in a system's performance in great depth and precision. In addition, it may provide reports and estimates at regular intervals. PVsyst's precision is nearly identical to the true values. Other notable aspects include the use of color to denote the severity of warnings and errors When using simulation tools, as opposed to size tools, the user is responsible for specifying the type as well as the size of each component. After that, the instrument offers a comprehensive evaluation of the operation of the system. According to,(28,29) the accuracy of the simulations performed in PVsyst is heavily dependent on the input meteorological data as well as the simulation settings chosen by the user. This work makes use of the PVsyst 7.2.11 program for modeling, analysis, and optimization. The program analyzes the data on the load demand as well as the solar energy and then simulates several sizes of PV, converters, and batteries to fit the load requirement. The PV system serves as the power supply for the system that was designed in this investigation for the department laboratories. PVsyst is a PV system simulation tool that incorporates pre-feasibility, sizing, and modeling support. After the location and loads have been set, the next step for the user is to pick the various components from a product database. The program will then automatically determine the size of each component based on the user's selections. The specific geographic location of the photovoltaic system employing.(26)
Set geographical coordinates
Mandali is a town in Balad Ruz District, Diyala/ Iraq, the Geographical coordinates for this town 33.7462677°N latitude, 45.5508208°E longitude. the monthly values of global irradiation, diffused irradiation and the sun path were calculated using PVsyst and are depicted in table 1 and figure 2.
|
Table 1. Monthly values of global irradiation and diffused irradiation |
||
|
Values |
GlobH |
DiffH |
|
Month |
kWh/m² |
kWh/m² |
|
January |
92,4 |
28,5 |
|
February |
110 |
31,6 |
|
March |
149,1 |
48,1 |
|
April |
165 |
59,7 |
|
May |
212,7 |
62,9 |
|
June |
239,4 |
53,4 |
|
July |
233,1 |
57,7 |
|
August |
212,4 |
52,1 |
|
September |
174,3 |
42,6 |
|
October |
122,8 |
41,2 |
|
November |
85,2 |
32,1 |
|
December |
80,3 |
27,3 |
|
Year |
1 876,6 |
537,2 |
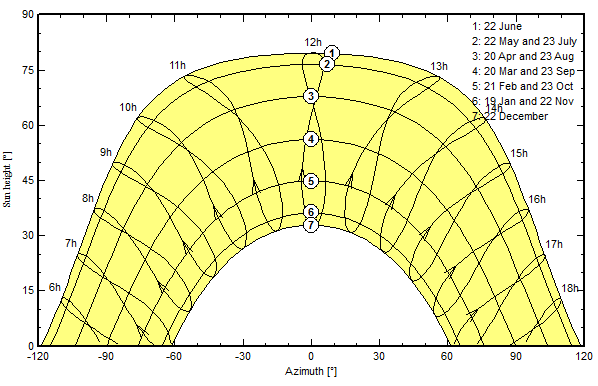
Figure 2. Location Sun path
Tilting of the solar panel
From field type, fixed tilted plane chosen. The optimum tilt angle will be 32O and 0O azimuth that get 0 % losses and maximum global irradiation on collector plane as shown in figure 3
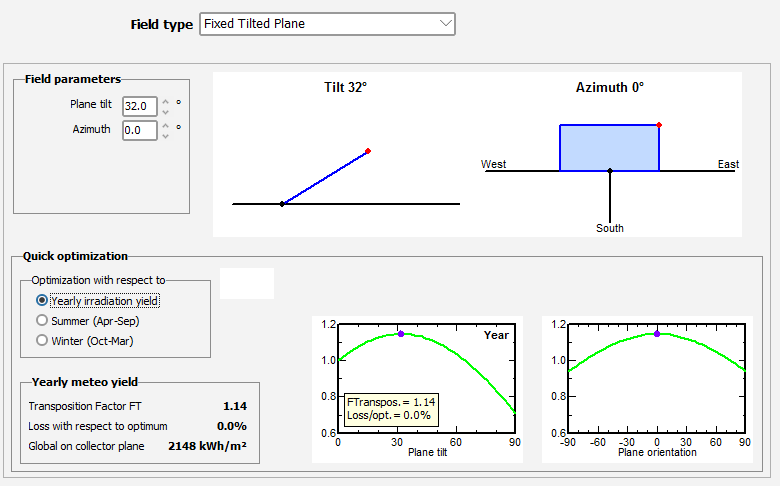
Figure 3. Tilting of the Solar Panel on Location
Estimating of the load
As shown in table 2 outlines the minimum daily load consumption requirements for home.
|
Table 2. Daily household consumers, Constant over the year, average = 12,6 kWh/day |
||||||
|
Number |
Appliance |
Power |
Daily use |
Daily energy |
||
|
h/day |
Wh |
|||||
|
10 |
Lamps(LED or fluo) |
10W |
lamp |
5,0 |
500 |
|
|
2 |
TV/PC/Mobile |
100 |
W/app |
5,0 |
1 000 |
|
|
1 |
Domestic appliances |
500 |
W/app |
4,0 |
2 000 |
|
|
2 |
Fridge/Deep-freeze |
0,80 |
KWh/day |
24 |
1 598 |
|
|
1 |
Dish-& Cloth-washers |
1000 |
Waver |
2 |
2 000 |
|
|
1 |
Ventilation |
100 |
W/app |
24,0 |
2 400 |
|
|
1 |
Air conditioning |
1000 |
W/app |
3,0 |
3 000 |
|
|
|
Stand-by consumers |
6 |
W tot |
24 |
144 |
|
|
Total daily energy Monthly energy |
12 642 Wh/day 379,3 kwh/mth |
|||||
System sizing
As shown in figure 4, all the specifications for stand-alone PV systems. Which contains the detail of PV module, battery and controller. The total module area is 22,7 m2. Two days for autonomy and 0,2 albedo as a default chosen when sizing this system.
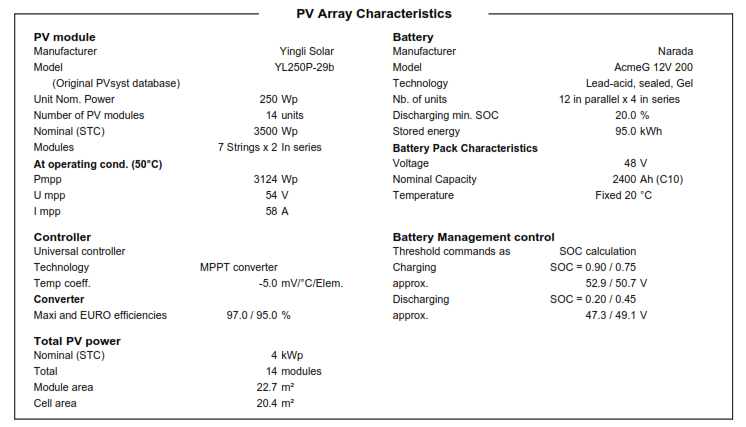
Figure 4. PV System Specifications
RESULTS AND DISCUSSION
This part shows an evaluation of how well a suggested stand-alone system with batteries. The PV system operates at Mandali /Iraq, the Geographical coordinates for this town 33.7462677°N latitude, 45.5508208°E longitude.
Table 3 presents an overview of the annual balances and key findings pertaining to the off-grid photovoltaic system. The imparted vitality to the consumer amounts to 4 614,5 kWh.
|
Table 3. The main results of off-grid PV system |
||||||||
|
|
GlobHor |
GlobEff |
E_Avail |
Unused |
E_Miss |
E_User |
E_Load |
SolFrac |
|
|
kWh/m² |
kWh/m² |
kWh |
kWh |
kWh |
kWh |
kWh |
ratio |
|
January |
92,4 |
139,1 |
426,2 |
0 |
0 |
391,9 |
391,9 |
1 |
|
February |
110 |
147,4 |
443,4 |
43,6 |
0 |
354 |
354 |
1 |
|
March |
149,1 |
175,5 |
519,2 |
104,5 |
0 |
391,9 |
391,9 |
1 |
|
April |
165 |
166,8 |
473,5 |
62,1 |
0 |
379,3 |
379,3 |
1 |
|
May |
212,7 |
195 |
529,9 |
107,3 |
0 |
391,9 |
391,9 |
1 |
|
June |
239,4 |
208,2 |
551 |
132,4 |
0 |
379,3 |
379,3 |
1 |
|
July |
233,1 |
208,8 |
545,8 |
129,8 |
0 |
391,9 |
391,9 |
1 |
|
August |
212,4 |
209,5 |
548,6 |
119,9 |
0 |
391,9 |
391,9 |
1 |
|
September |
174,3 |
197,4 |
527 |
122,6 |
0 |
379,3 |
379,3 |
1 |
|
October |
122,8 |
154 |
432,8 |
21,2 |
0 |
391,9 |
391,9 |
1 |
|
November |
85,2 |
119,7 |
353,1 |
0 |
0 |
379,3 |
379,3 |
1 |
|
December |
80,3 |
125,5 |
380,9 |
0 |
0 |
391,9 |
391,9 |
1 |
|
Year |
1 876,6 |
2 046,9 |
5 731,6 |
843,4 |
0 |
4 614,5 |
4 614,5 |
1 |
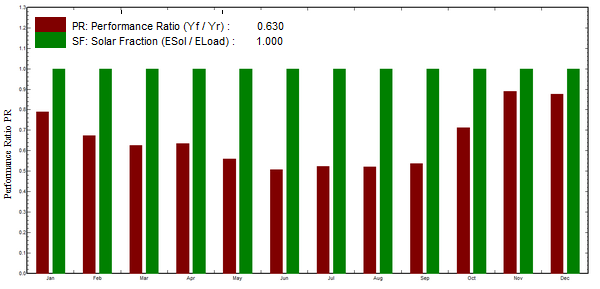
Figure 5. The solar fraction
Figure 5 shows that the percentage of executions in the test computer program was pretty much the same for each month. Also shown in figure 5 are the performance ratio and the solar fraction. Table 4 shows the numerical number of the solar fraction (SF) to each month. (Yf) is the end yield from the PV system, and Yr is the reference yield this is what the Performance ratio (PR) is:
![]()
|
Table 4. Monthly performance ratio and solar fraction |
||
|
Month |
PR |
SF |
|
January |
0,7903 |
1 |
|
February |
0,6738 |
1 |
|
March |
0,6251 |
1 |
|
April |
0,6343 |
1 |
|
May |
0,5593 |
1 |
|
June |
0,5061 |
1 |
|
July |
0,5222 |
1 |
|
August |
0,5218 |
1 |
|
September |
0,5369 |
1 |
|
October |
0,7127 |
1 |
|
November |
0,8892 |
1 |
|
December |
0,8757 |
1 |
|
Year |
0,63 |
1 |
The results show in table 5 that during month November yielded the highest photovoltaic performance ratio (PR) at 87,57 %, which can be attributed to the low temperatures of the PV module. Conversely, the lowest PR of 50,61 % was observed in June , likely caused by the high temperatures of the PV module. In contrast, the yearly mean public relations (PR) is at 63 %.
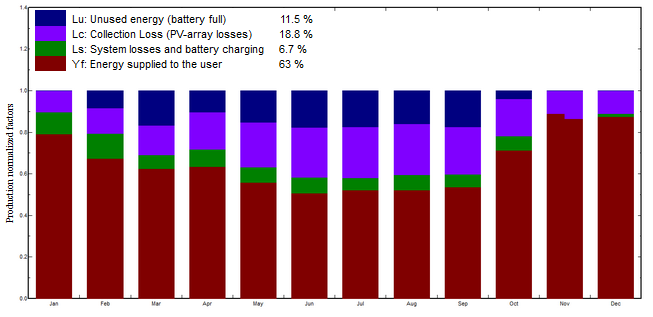
Figure 6. Normalized monthly productions with losses
Figure 6 displays the monthly energy supplied to the user, accounting for losses. Various types of field losses occur in freestanding photovoltaic systems throughout the year, as seen in figure 7.
In table 5 show the normalized performance coefficients of the system and explain how to find Yf from Yr then applying equation 14 to find PR
|
Table 5. Normalized Performance Coefficients |
||||||||
|
|
Yr |
Lu |
Yu |
Lc |
Ya |
Ls |
Yf |
PR |
|
|
kWh/m²/day |
ratio |
kWh/kWp/day |
ratio |
kWh/kWp/day |
ratio |
kWh/kWp/day |
ratio |
|
January |
4,57 |
0 |
4,57 |
0,474 |
4,1 |
0,485 |
3,610 |
0,79 |
|
February |
5,36 |
0,445 |
5,36 |
1,107 |
4,25 |
0,641 |
3,610 |
0,674 |
|
March |
5,78 |
0,963 |
5,78 |
1,79 |
3,99 |
0,376 |
3,610 |
0,625 |
|
April |
5,69 |
0,592 |
5,69 |
1,602 |
4,09 |
0,481 |
3,610 |
0,634 |
|
May |
6,46 |
0,989 |
6,46 |
2,382 |
4,08 |
0,464 |
3,610 |
0,559 |
|
June |
7,14 |
1,26 |
7,14 |
2,969 |
4,17 |
0,556 |
3,610 |
0,506 |
|
July |
6,92 |
1,197 |
6,92 |
2,91 |
4,01 |
0,395 |
3,610 |
0,522 |
|
August |
6,92 |
1,105 |
6,92 |
2,802 |
4,12 |
0,508 |
3,610 |
0,522 |
|
September |
6,73 |
1,168 |
6,73 |
2,713 |
4,02 |
0,403 |
3,610 |
0,537 |
|
October |
5,07 |
0,196 |
5,07 |
1,108 |
3,96 |
0,348 |
3,610 |
0,713 |
|
November |
4,06 |
0 |
4,06 |
0,545 |
3,52 |
-0,095 |
3,610 |
0,889 |
|
December |
4,12 |
0 |
4,12 |
0,458 |
3,67 |
0,055 |
3,610 |
0,876 |
|
Year |
5,74 |
0,66 |
5,74 |
1,741 |
4 |
0,383 |
3,610 |
0,63 |
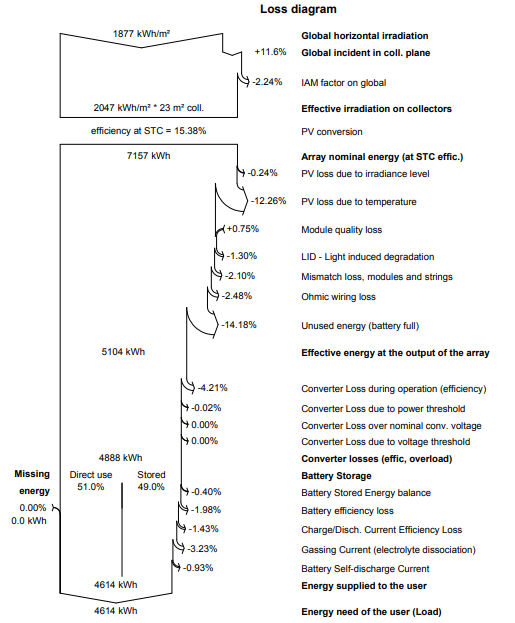
Figure 7. Yearly system losses diagram
CONCLUSIONS
This study for designs and sizes a stand-alone system using PVsyst software to power a house in Iraq's Mandali city. The normal amount of energy used in a year is 4 614,5 kWh, and the amount of energy that can be gotten from solar panels is 5 731,6 kWh. However, the user only gets 4 614,5 kWh, which is a little less than what they need. There are different types of losses that cause the system's power output to drop.
Based on performance ratio study, the maximum PR was 87,57 % in November due to low module temperature, while the lowest PR, 50,61 %, was in June due to high PV module temperature. The average PR for the year is 63 %. From the results, the System Yield (Yf) is constant for all year but Reference system Yield(22) is proportional to the energy that has fallen on the array plane and its perfect array Manufacturer-defined Pnom yield without loss, which found is changeable for all year and for this reason the PR depend on it. Materials technology, generation, and manufacture affect PV frameworks. PV system modelling losses depend on module behaviour. PVsyst analyzes all losses. PVsyst targets all PV framework components, including loss causes, with appropriate models.PV production is unknown due to Meteo information (source and yearly inconstancy), PV module model, and fabrication details. Install roof-top solar panels to meet home or small factory load requirements to become self-sufficient. This article can aid off-grid design and work.
REFERENCES
1. K. Amin, M. N. Islam, A. Jaman, M. K. Hasan, and M. M. R. Chy, "Implementation of a Small-Scale Smart Energy Storage Scheme for Hybrid Renewable Power Sources," in 2022 12th International Conference on Electrical and Computer Engineering (ICECE), 2022, pp. 324-327.
2. L. F. Abdulrazak, A. Islam, and M. B. J. E. S. R. Hossain, "Towards energy sustainability: Bangladesh perspectives," vol. 38, p. 100738, 2021.
3. M. E. K. Sopian, M.H. Ruslan, Ali Najah Al-Shamani, B. Elhub, Azher M. Abed, HusamAbdulrasool Hasan, M. M. S. Dezfouli, "A stand-alone Photovoltaic System Design and Sizing: a Greenhouse Application in Sabha City: Case study in Libya," Engineering Science And Technology International Conference (ESTIC), vol. Vol. 3, 2017.
4. Alamri and A. Alamri, "Technical review of energy storage technologies when integrated with intermittent renewable energy," in 2009 International Conference on Sustainable Power Generation and Supply, 2009, pp. 1-5.
5. S. Alsadi and T. Khatib, "Photovoltaic Power Systems Optimization Research Status: A Review of Criteria, Constrains, Models, Techniques, and Software Tools," Applied Sciences, vol. 8, 2018.
6. S. C. S. Costa, A. S. A. C. Diniz, and L. L. Kazmerski, "Solar energy dust and soiling R&D progress: Literature review update for 2016," Renewable and Sustainable Energy Reviews, vol. 82, pp. 2504-2536, 2018/02/01/ 2018.
7. M. Al-Riahi, N. Al-Hamdani, and H. J. R. e. Al-Saffar, "Some aspects of solar radiation climatology of Iraq," vol. 2, pp. 167-173, 1992.
8. K. I. J. I. J. o. E. S. I. Abass, "Is Iraq Ready to Use Solar Energy Applications: A Review," vol. 6, pp. 27-42, 2017.
9. S. Iftiquar, Y. Lee, V. A. Dao, S. Kim, J. J. M. Yi, p. f. e. c. c. research, et al., "High efficiency heterojunction with intrinsic thin layer solar cell: A short review," pp. 59-67, 2013.
10. M. Yaichi, M.-K. Fellah, A. J. I. J. o. P. E. Mammeri, and D. Systems, "A neural network based MPPT technique controller for photovoltaic pumping system," vol. 4, p. 241, 2014.
11. M. A. Abdourraziq, M. J. I. J. o. P. E. Maaroufi, and D. Systems, "Experimental Verification of the main MPPT techniques for photovoltaic system," vol. 8, p. 384, 2017.
12. J. A. Duffie and W. A. Beckman, Solar engineering of thermal processes: John Wiley & Sons, 2013.
13. R. Eke and A. J. S. E. Senturk, "Performance comparison of a double-axis sun tracking versus fixed PV system," vol. 86, pp. 2665-2672, 2012.
14. K. Sopian, A. Fudholi, M. H. Ruslan, M. Y. Sulaiman, M. A. Alghoul, M. Yahya, et al., "Hydrogen production from combined wind/PV energy hybrid system in Malaysia," in Proceedings of the 4th IASME/WSEAS International Conference on ENERGY & ENVIRONMENT, 2009.
15. K. Sopian, A. Fudholi, M. H. Ruslan, M. Y. Sulaiman, M. A. Alghoul, M. Yahya, et al., "Optimization of a Stand-alone wind/PV hybrid system to provide electricity for a household in Malaysia," in IASME/WSEAS international conference on energy & environment, 2009.
16. Z. Gao, S. Li, X. Zhou, and Y. Ma, "An overview of PV system," in 2016 IEEE International Conference on Mechatronics and Automation, 2016, pp. 587-592.
17. T. K. Das, A. Banik, S. Chattopadhyay, and A. Das, "Sub-harmonics based string fault assessment in solar PV arrays," in Modelling and Simulation in Science, Technology and Engineering Mathematics: Proceedings of the International Conference on Modelling and Simulation (MS-17), 2019, pp. 293-301.
18. T. K. Das, A. Banik, S. Chattopadhyay, and A. Das, "FFT based classification of solar photo voltaic microgrid system," in 2019 Second International Conference on Advanced Computational and Communication Paradigms (ICACCP), 2019, pp. 1-5.
19. Banik, A. J. I. i. E. M. Sengupta, and R. Resources, "Scope, challenges, opportunities and future goal assessment of floating solar park," pp. 1-5, 2021.
20. S. Muthulingam, K. B. Bae, R. Khan, I.-H. Lee, and P. J. R. a. Uthirakumar, "Improved daylight-induced photocatalytic performance and suppressed photocorrosion of N-doped ZnO decorated with carbon quantum dots," vol. 5, pp. 46247-46251, 2015.
21. N. Loganathan, C. Muniraj, S. J. I. T. o. D. Chandrasekar, and E. Insulation, "Tracking and erosion resistance performance investigation on nano-sized SiO 2 filled silicone rubber for outdoor insulation applications," vol. 21, pp. 2172-2180, 2014.
22. V. Tyagi, N. A. Rahim, N. Rahim, A. Jeyraj, L. J. R. Selvaraj, and s. e. reviews, "Progress in solar PV technology: Research and achievement," vol. 20, pp. 443-461, 2013.
23. W. Ali, H. Farooq, A. U. Rehman, Q. Awais, M. Jamil, and A. Noman, "Design considerations of stand-alone solar photovoltaic systems," in 2018 International conference on computing, electronic and electrical engineering (ICE Cube), 2018, pp. 1-6.
24. T. Khatib, A. Mohamed, K. Sopian, and M. J. I. J. o. P. Mahmoud, "A new approach for optimal sizing of standalone photovoltaic systems," vol. 2012, 2012.
25. L. Mahmood, "Design and Simulation of Stand-alone PV System for Electronic and Communications Engineering Department Laboratories in Al-Nahrain University," EAI Endorsed Transactions on Energy Web, vol. 0, 2018.
26. Y. M. Irwan, A. R. Amelia, M. Irwanto, W. Z. Leow, N. Gomesh, and I. Safwati, "Stand-alone photovoltaic (SAPV) system assessment using PVSYST software," Energy Procedia, vol. 79, pp. 596-603, 2015.
27. J. E. e. T. o. E. w. Mahmood, "Design and simulation of stand-alone pv system for electronic and communications engineering department laboratories in Al-Nahrain University," vol. 6, pp. e9-e9, 2019.
28. H. A. Guda and U. O. Aliyu, "Design of a stand-alone photovoltaic system for a residence in Bauchi," International Journal of Engineering and Technology, vol. 5, pp. 34-44, 2015.
29. G. P. Okhotkin, A. Serebryannikov, V. Zakharov, and S. G. J. E. S. W. o. C. Chumarov, "Method for Calculating the Capacity of Solar Power Plants and its Implementation in LabVIEW Environment," 2019.
FINANCING
The authors did not receive financing for the development of this research.
CONFLICT OF INTEREST
The authors declare that there is no conflict of interest.
AUTHORSHIP CONTRIBUTION
Conceptualization: Shaima Mahmoud Dhiyab Al-Janabi, Fadhel A. Jumaa.
Data curation: Shaima Mahmoud Dhiyab Al-Janabi, Fadhel A. Jumaa.
Formal analysis: Shaima Mahmoud Dhiyab Al-Janabi, Fadhel A. Jumaa.
Research: Shaima Mahmoud Dhiyab Al-Janabi, Fadhel A. Jumaa.
Methodology: Shaima Mahmoud Dhiyab Al-Janabi, Fadhel A. Jumaa.
Drafting - original draft: Shaima Mahmoud Dhiyab Al-Janabi, Fadhel A. Jumaa.
Writing - proofreading and editing: Shaima Mahmoud Dhiyab Al-Janabi, Fadhel A. Jumaa.