Category: STEM (Science, Technology, Engineering and Mathematics)
ORIGINAL
Modeling of Automobile Assembly Line Performance Using ARENA Simulation Software
Modelización del rendimiento de la línea de montaje de automóviles mediante el software de simulación ARENA
Ali J. Mohammed1 *, Amjad B. Abdulghafour1 *, Abass M.Jabber AL- Enzi1 *
1Department of Production Engineering and Metallurgy, University of Technology, Baghdad, Iraq.
Cite as: Mohammed AJ, Abdulghafour AB, Jabber AL- Enzi AM. Modeling of Automobile Assembly Line Performance Using ARENA Simulation Software . Salud, Ciencia y Tecnología - Serie de Conferencias. 2024; 3:828. https://doi.org/10.56294/sctconf2024828
Submitted: 22-01-2024 Revised: 04-04-2024 Accepted: 01-06-2024 Published: 02-06-2024
Editor: Dr.
William Castillo-González ![]()
Note: Paper presented at the 3rd Annual International Conference on Information & Sciences (AICIS’23).
ABSTRACT
Due to the intense competition in today’s business environment, companies must continuously analyze and enhance their existing manufacturing systems. Discrete event simulation, which is especially helpful for simulating queuing systems, involves describing the system as it evolves. The building and study of a simulation model of an existing production line are the main topics of this paper. The findings demonstrate that the current system’s throughput is low due to bottlenecks, extended processing times at workstations, and inefficient resource utilization, all contribute to productivity losses in automotive assembly lines. This paper aims to evaluate the efficiency of the production line performance of automobile assembly lines using Arena modeling and simulation. Data provided by the company’s management is utilized to calculate the processing time and standard time for each step in the production line. Additional information is gathered through direct observation of the assembly line. A car assembly manufacturing line was selected as a case study, and Arena 16.0 software was employed for basic modeling and analysis to achieve these objectives.
Keywords: Computer Simulation; Assembly Line; Arena; Bottlenecks; Modeling; Throughput.
RESUMEN
Debido a la intensa competencia en el entorno empresarial actual, las empresas deben analizar y mejorar continuamente sus sistemas de fabricación existentes. La simulación de eventos discretos, especialmente útil para simular sistemas de colas, consiste en describir el sistema a medida que evoluciona. La construcción y el estudio de un modelo de simulación de una línea de producción existente son los temas principales de este artículo. Los resultados demuestran que el rendimiento del sistema actual es bajo debido a los cuellos de botella, los tiempos de procesamiento prolongados en las estaciones de trabajo y la utilización ineficiente de los recursos, todo lo cual contribuye a las pérdidas de productividad en las líneas de montaje de automóviles. El objetivo de este trabajo es evaluar la eficiencia del rendimiento de las líneas de montaje de automóviles mediante el modelado y la simulación Arena. Se utilizan datos proporcionados por la dirección de la empresa para calcular el tiempo de procesamiento y el tiempo estándar de cada paso de la línea de producción. Se recopila información adicional mediante la observación directa de la cadena de montaje. Se seleccionó una cadena de montaje de automóviles como caso de estudio y se empleó el software Arena 16.0 para la modelización y el análisis básicos con el fin de alcanzar estos objetivos.
Palabras clave: Simulación por Ordenador; Línea de Montaje; Arena; Cuellos de Botella; Modelado; Rendimiento.
INTRODUCTION
In today’s rapidly and dynamically changing economic conditions, manufacturing industries face considerable difficulties as manufacturing technology continues to advance in the age of globalization. For instance, they are ensuring customer satisfaction, predicting product demand for the market, increasing factory efficiency, fierce market competition, technological advancements, etc. Manufacturing company managers and engineers are actively looking for ways to deal with significant issues in production lines. These difficulties include problems with inefficiency, long waits, and processing times at workstations, all of which harm production and raise costs. The simulation technique known as discrete-event system simulation is used to study, analyze, and optimize manufacturing systems.(1) The objective of this paper is to give the industry a comprehensive set of tools, techniques, and procedures to allow examination of current worker and machine performance systems using a consequent simulation system model that could be used before an existing system is altered or a new system is built, to reduce the likelihood of failure to meet specifications, to eliminate unforeseen bottlenecks, to prevent under- or over-utilization of resources, and to optimize Simulated events might be discrete or continuous. The system’s state is constantly changing throughout time under a constant model. However, in a discrete model, changes can only occur at specific moments. In this study, the performance of workers and machinery at The General Company for the Automotive Industry is modeled using discrete event simulation. An essential step in ensuring that the firm’s operations are running smoothly is to simulate the firm’s activities using a discrete event simulations program, such as the Arena software, analyze the results of the simulation, and continually seek out and implement solutions to optimize the experimental model and to ensure efficient use of the available resources.(2)
Related Works
Production can be defined as the systematic transformation of one material form into another through chemical or mechanical processes to generate or improve the product’s utility for the end user. Therefore, production constitutes a process that adds value.(3) At every phase of processing, there is an incremental increase in value. Discrete-event simulation may be helpful in various disciplines because it enables projects to be studied and their feasibility to be determined without making significant investments. Identifying waste, improving the layout, and working on the line balance for optimizing resources helped improve the productivity of the assembly line.(4) There is a lot of literature on applying simulation to manufacturing systems. Han et al. have used DES models to show the advantages of using VSM as a lean technique. Use simulation to address the issue of quality inspection.(5) A computer simulation analysis was conducted to model production process efficiency, perform product life analyses of the production line, and address the allocation of intermediate buffers.(6) A TV assembly/production line’s performance was measured to meet the study’s objective. A detailed analysis revealed that the production line had bottlenecks, which were queuing the stations.(4) The research demonstrated the integration of critical lean tools, such as Value Stream Mapping (VSM), with the simulation of a batch production system’s current and future states in the leather industry.(7) The study focuses on Simulating the automobile repair shop firm’s activities using Arena software to analyze the result.(8) The repair shop’s capacity is primarily influenced by the possibility of an event that designates a specific number of vehicles to each intervention category(9) focused on line balancing in a textile business using simulation and optimization approaches. The study aimed to streamline material flows within the company, maximize labor capacity utilization, minimize cycle times and material requirements for processes, and eliminate bottlenecks for efficient capacity utilization.(10)
METHODOLOGY
The research’s methodology explained in Figure 1 illustrations. The details of each section of the methodology flow chart are provided in the following paragraphs.
The State Company for automobile assembly manufacturers of SAIPA saloon cars, Selecting the company and production line which correlates with the objective of the study is one of the important aspects in conducting the study.
Data Collection
For simulation and verification, real-world operational data are required. The information was gathered by keeping an eye on the line. Entities per arrival, line configuration, and machine process types comprise the data collected. The company’s management provided the processes and standards for each line’s operations. The model built into ARENA software is discussed in regular meetings with the center’s engineer.

Figure 1. Suggested Methodology Steps
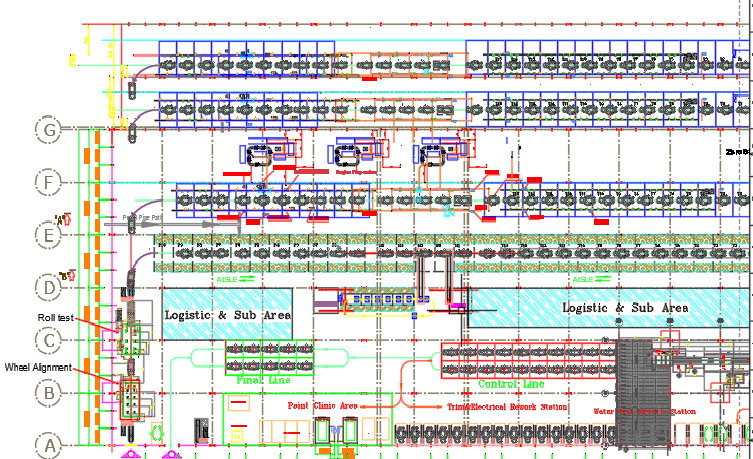
Figure 2. The layout of productions line
|
Table 1. Step by Step Line SAIPA Assembled |
||
|
Assembly operation stations |
Activities to be performed |
Abbreviations of the operation |
|
1 |
-Washing the body and prepare to assemble - Connecting the fuel tank |
T0 |
|
2 |
- Connecting the insulation under the dashboard - Connecting the door lock |
T01 |
|
3 |
-Prepare the main and subsidiary wires -link the hand brake |
T02 |
|
4 |
- Connecting the brake separator to the pipes - Connecting (wiper motor) with the arms |
T03 |
|
5 |
- Connecting steering column - Connecting pedals(klieg, fuel, brakes) |
T04 |
|
6 |
- Connecting the cooling radiator - Buckle the back seat belt |
T05 |
|
7 |
- Connecting the front doors - Front door glass installation |
T06 |
|
8 |
- Connect the back doors - Rear door glass installation |
T07 |
|
9 |
- Bonding of ground insulation and floor covering - Connecting the four door locks |
T08 |
|
10 |
- Connecting the rear bumper and taillights - Connecting the box lock |
T09 |
|
11 |
- Connecting the cooling system with the fan - Dashboard placement and instrument cluster |
T10 |
|
12 |
- Connecting the cooling tubes - Attaching the front strut |
T11 |
|
13 |
- Front and rear linkage - Connecting parts of the structure |
T12 |
|
14 |
- Attaching side mirrors - Connecting the steering wheel |
T13 |
|
15 |
- Vehicle inspection point by quality control |
T14 |
|
16 |
-Connecting the side brake to the brick tubes - Installing the double in (Shift Drive) - Installing the engine |
M01 |
|
17 |
-Connecting the fuel hose -Attaching the exhaust insulator |
M02 |
|
18 |
- Installing the four wheels -Connecting the front brakes |
M03 |
|
19 |
-Connecting air ducts and air filter and power tubes - Connecting the radiator |
F01 |
|
20 |
-Connecting headlights -Connecting the fuse box -Installing water sprinklers for the windshield |
F02 |
|
21 |
- Connecting the front and back seats - Preparing the battery - Installing the front and back windows |
F03 |
|
22 |
- Filling the radiator with water - Filling the car engine with oils - Filling refrigerant gas into the cooling system - Filling the tank with fuel - Filling the steering wheel oil |
F04 |
|
23 |
- Definition and programming of the control panel - Vehicle inspection point by quality control |
F05 |
|
Table 2. Average times and number of worker in stations |
||
|
Abbreviations of the operation |
Mean processing time for each station |
No worker each station |
|
T0 |
10 |
4 |
|
T01 |
15 |
4 |
|
T02 |
15 |
4 |
|
T03 |
15 |
7 |
|
T04 |
15 |
7 |
|
T05 |
15 |
6 |
|
T06 |
15 |
5 |
|
T07 |
15 |
6 |
|
T08 |
15 |
7 |
|
T09 |
15 |
6 |
|
T10 |
15 |
5 |
|
T11 |
15 |
5 |
|
T12 |
15 |
5 |
|
T13 |
15 |
5 |
|
T14 |
15 |
5 |
|
M01 |
15 |
6 |
|
M02 |
15 |
6 |
|
M03 |
15 |
6 |
|
F01 |
15 |
4 |
|
F02 |
15 |
3 |
|
F03 |
15 |
2 |
|
F04 |
15 |
4 |
|
F05 |
15 |
4 |
Building of Model & Simulation by ARENA
A comprehensive simulation model has been developed using ARENA simulation software version 14, which is a powerful tool for modeling and analyzing systems. This model represents the assembly line for SAIPA saloon cars. The production operates on a single shift per day, with a total available time of 7,5 hours per shift. This includes a 30-minute lunch break.
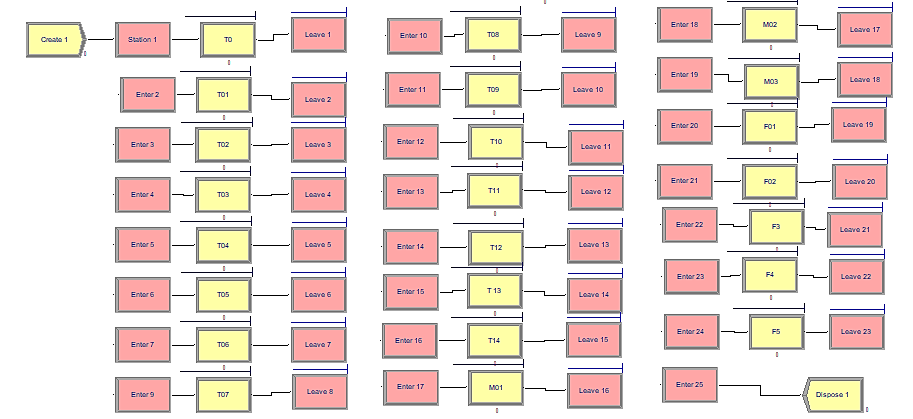
Figure 3. Simulation Model of Production Line
Verification and Validation of Model
Simulation models are used to represent real-world systems, but they can never be exact duplicates of those systems. These models provide a simplified version of the system that can be used to analyze and predict its behavior under different conditions. It is important to keep in mind that the accuracy of the model depends on the quality and completeness of the data used to create it. It is essential to thoroughly verify and validate a model for its intended use. Verification ensures correct implementation of a model’s design. Validation involves evaluating how closely a simulation model and its associated data resemble the actual real-world system. This comparison involves analyzing and comparing the simulation model outputs with the performance of the existing system. According to the simulation model, the daily production output for five replications averaged 28 cars which aligns with the system’s actual daily production of 28 vehicles. This indicates that the simulation accurately reflects the production line.
RESULTS AND DISCUSSION
In this section, we will present and discuss the results of this study, providing a detailed analysis of the findings and their implications.
Designing an effective system requires understanding, data collection, and rigorous verification.
1. The downtime of all machines could be higher on average.
2. After analyzing the time data, it is clear that jobs should be distributed evenly.
3. The labor costs associated with the production line exceed the planned budget.
There are three main effected parameters on production assembly line:
1. Workers utilization: The number of workers is more than the planned number. At the same time, most of the individuals in the organization work with little efficiency.
|
Table 3. The relation between number in and out of cars in line |
|
|
Number Out |
28 |
|
Number In |
59 |
|
Average WIP |
32 |
|
Table 4. The calculation of salary costs |
|
|
Total no of worker |
116 |
|
Each worker has salary |
400,000 IQD |
|
Total salary in month |
46,400,000 IQD |
|
Total salary for 6 months |
278,400,000 IQD |
|
Table 5. Number of workers with their efficiency percentage |
||
|
Worker symbol with number of station |
No Worker |
Value Utilization |
|
W M1 |
6 |
7,9 % |
|
W0 |
4 |
13,6 % |
|
W01 |
4 |
18 % |
|
W02 |
4 |
16,8 % |
|
W03 |
7 |
10 % |
|
W04 |
7 |
9,9 % |
|
W05 |
6 |
9,9 % |
|
W06 |
5 |
12,4 % |
|
W07 |
6 |
10,4 % |
|
W08 |
7 |
8,5 % |
|
W09 |
6 |
9,6 % |
|
W10 |
5 |
11,7 % |
|
W11 |
5 |
11,6 % |
|
W12 |
5 |
10,9 % |
|
W13 |
5 |
8,9 % |
|
W14 |
5 |
17,7 % |
|
WF1 |
4 |
10,3 % |
|
WF2 |
3 |
13,7 % |
|
WF3 |
2 |
19,7 % |
|
WF4 |
4 |
9,5 % |
|
WF5 |
4 |
9,4 % |
|
WM2 |
6 |
15,6 % |
|
WM3 |
6 |
15,6 % |
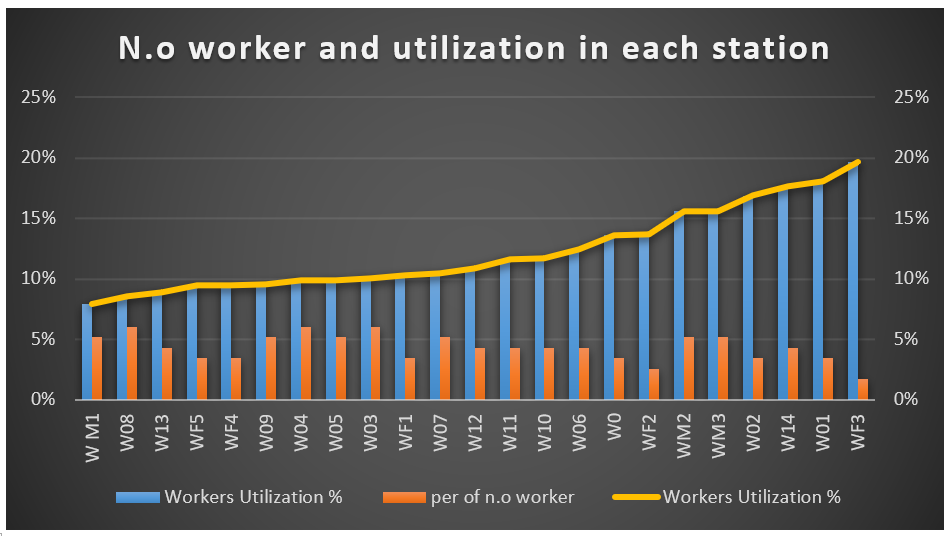
Figure 4. The output of existing production lines for worker
• Work-In-Process (WIP): The current quantity of work in process exceeds the planned amount. Simultaneously, aligning work-in-process (WIP) with an enhanced throughput can be realized through efficient inventory management and process optimization.
|
Table 6. The Station name queue and average waiting time |
||
|
No. |
Station name queue |
Average waiting time |
|
1 |
F01.Queue |
0,00 |
|
2 |
F02.Queue |
0,00 |
|
3 |
F4.Queue |
6,4296 |
|
4 |
F5.Queue |
0,00 |
|
5 |
M01.Queue |
0,00 |
|
6 |
M02.Queue |
17,0946 |
|
7 |
M03.Queue |
18,7270 |
|
8 |
T 13.Queue |
19,4500 |
|
9 |
T0.Queue |
18,9320 |
|
10 |
T01.Queue |
19,0098 |
|
11 |
T02.Queue |
19,2417 |
|
12 |
T03.Queue |
18,5868 |
|
13 |
T04.Queue |
18,7662 |
|
14 |
T05.Queue |
19,0097 |
|
15 |
T06.Queue |
19,6863 |
|
16 |
T07.Queue |
18,7174 |
|
17 |
T08.Queue |
18,7591 |
|
18 |
T09.Queue |
18,9236 |
|
19 |
T10.Queue |
19,9721 |
|
20 |
T11.Queue |
19,3084 |
|
21 |
T12.Queue |
19,0719 |
|
22 |
F3.Queue |
19,3494 |
|
23 |
T14.Queue |
19,4610 |
CONCLUSIONS
The existing assembly production line was analyzed, and existing setup bottlenecks were identified in the process. A simulation-based model was developed using the Arena 16 simulation package, and generated results were tested with production line manufacturing mentioned in the case study. All the values used in the comparison were generated by simulation in Arena 16 at five replication lengths for six-month run periods. A discrete-event system simulation is a powerful tool for modeling and analyzing manufacturing systems. It has a good record of applications in the industrial sector. This study illustrates the benefits of the time/cost tradeoff, including the potential advantage of achieving good service levels and helping companies avoid unnecessary investments. The presented work scope can be to improve the cost associated with labor and maintenance costs.
REFERENCES
1. E. CARATA, “Analysis of shop floor machine parts manufacturing through discrete event simulation,” Univ. Teh. „Gheorghe Asachi” din Iaşi, vol. 66, p. 70, 2020.
2. T. Araya, Simulation with ARENA. McGraw-hill, 2002.
3. S. Anil Kumar and N. Suresh, Production and operations management:(with skill development, caselets and cases). New Age International (P) Ltd., Publishers, 2008.
4. G. A. Benti* and 1 & Dr. Balkeshwar Singh2, “INTERNATIONAL JOURNAL OF ENGINEERING SCIENCES & RESEARCH TECHNOLOGY,” 2019.
5. S. H. Han, M. Al-Hussein, S. Al-Jibouri, and H. Yu, “Automated post-simulation visualization of modular building production assembly line,” Autom. Constr., vol. 21, pp. 229–236, 2012.
6. S. Kłos and J. Patalas-Maliszewska, “Throughput analysis of automatic production lines based on simulation methods,” in International Conference on Intelligent Data Engineering and Automated Learning, 2015, pp. 181–190.
7. A. S. Kathem, L. A. H. Al-Kindi, and Z. Al-Baldawi, “Integration of Lean Concepts and Line balancing Focusing on Value Adding Activities,” Des. Eng., no. 6, pp. 6263–6275, 2021.
8. P. Pawlewski and M. Fertsch, “Modeling and simulation method to find and eliminate bottlenecks in production logistics systems,” in Proceedings of the 2010 Winter Simulation Conference, 2010, pp. 1946–1956.
9. I. Radulescu, A. C. Tociu, and A. V Radulescu, “Modeling and simulating the activities in an automobile repair shop using ARENA software–part 1,” in IOP Conference Series: Materials Science and Engineering, 2020, vol. 997, no. 1, p. 12128.
10. G. Çalışkan, “Bir tekstil işletmesinde simülasyonoptimizasyon yaklaşımı ile hat dengeleme çalışması.” Pamukkale Üniversitesi Fen Bilimleri Enstitüsü, 2020.
FINANCING
None.
CONFLICT OF INTEREST
None.
AUTHORSHIP CONTRIBUTION
Conceptualization: Ali J. Mohammed, Amjad B. Abdulghafour, Abass M.Jabber AL- Enzi.
Research: Ali J. Mohammed, Amjad B. Abdulghafour, Abass M.Jabber AL- Enzi.
Writing - original draft: Ali J. Mohammed, Amjad B. Abdulghafour, Abass M.Jabber AL- Enzi.
Writing - revision and editing: Ali J. Mohammed, Amjad B. Abdulghafour, Abass M.Jabber AL- Enzi.