Categoría: STEM (Science, Technology, Engineering and Mathematics)
ORIGINAL
Effects of steel reinforcement ratios on the flange effective width for reinforced concrete T-beams casting with recycled coarse aggregate
Efectos de las proporciones de armadura de acero en la anchura efectiva del ala de vigas en T de hormigón armado moldeadas con árido grueso reciclado
Ali Mohsin Razooq1 *, Eyad Kadhem Sayhood1 *, Ali Sadiq Resheq1 *
1Civil Engineering Department, University of Technology. Baghdad, Iraq.
Cite as: Mohsin Razooq A, Sayhood EK, Sadiq Resheq A. Effects of steel reinforcement ratios on the flange effective width for reinforced concrete T-beams casting with recycled coarse aggregate. Salud, Ciencia y Tecnología - Serie de Conferencias. 2024; 3:820. https://doi.org/10.56294/sctconf2024820
Submitted: 19-01-2024 Revised: 01-04-2024 Accepted: 27-05-2024 Published: 28-05-2024
Editor: Dr.
William Castillo-González ![]()
Note: paper presented at the 3rd Annual International Conference on Information & Sciences (AICIS’23).
ABSTRACT
Concrete waste in large quantities has caused environmental damage and requires landfilling places and effort. Therefore, concrete waste has been recycled, and new concrete has been produced, which is called recycled aggregate concrete (RAC). In this work, study the behavior of T-beams with recycled aggregate concrete is investigated, and the parameters studied on T-beams are as follows: (Replacing natural coarse aggregate (NCA) with 100 % recycled coarse aggregate (RCA), increasing the flexural reinforcing ratio (ρw) in percentage (25 % and 50 %), increasing the shear reinforcing ratio (ρv) according to (Ø10@50mm and Ø12@75mm), and increasing the flange reinforcing ratio (ρf) in percentage (50 % and 100 %) to find the effects of these parameters on the longitudinal strain distribution on the top surface of the flange, flange effective width, deflections, and the development of cracks. Eight beams’ specimens are tested, and the results of the tested beams show that; the replacing natural coarse aggregate (NCA) with 100 % recycled coarse aggregate (RCA) leads to a decrease in the longitudinal strains distribution, flange effective width, and increase in deflections. The increase in the flexural reinforcing steel ratio (ρw) leads to an increase in the longitudinal strains distribution, flange effective width, and decrease in deflections. The increase in the shear reinforcing steel ratio (ρv) leads to a very little increase in longitudinal strains distribution, flange effective width, and decrease in deflection, and this parameter effects is very little and can be neglected. Finally, the increase in flange reinforcing steel ratio (ρf) leads to an increase in longitudinal strain distribution and flange effective width and a decrease in deflection.
Keywords: T- Beams Recycle Coarse Aggregate; Effective Flange Width; Steel Reinforcement Ratios; Longitudinal Strain Distribution; Flange Effective Width.
RESUMEN
Los residuos de hormigón en grandes cantidades han causado daños al medio ambiente y requieren lugares de vertido y esfuerzo. Por lo tanto, los residuos de hormigón se han reciclado, y se ha producido un nuevo hormigón, que se denomina hormigón de áridos reciclados (HACR). En este trabajo, se investiga el comportamiento de vigas en T con hormigón de áridos reciclados, y los parámetros estudiados en las vigas en T son los siguientes: (Sustitución del árido grueso natural (NCA) por árido grueso reciclado (RCA) al 100 %, aumento de la relación de refuerzo a flexión (ρw) en porcentaje (25 % y 50 %), aumento de la relación de refuerzo a cortante (ρv) según (Ø10@50mm y Ø12@75mm), y aumento de la relación de refuerzo al ala (ρf) en porcentaje (50 % y 100 %) para encontrar los efectos de estos parámetros sobre la distribución de la deformación longitudinal en la superficie superior del ala, la anchura efectiva del ala, las flechas y el desarrollo de fisuras. Se ensayaron ocho vigas y los resultados mostraron que la sustitución del árido grueso natural (NCA) por árido grueso reciclado (RCA) al 100 % provocó una disminución de la distribución de las deformaciones longitudinales, de la anchura efectiva del ala y un aumento de las deformaciones. El aumento de la proporción de acero de refuerzo a flexión (ρw) conduce a un aumento de la distribución de las deformaciones longitudinales, la anchura efectiva del ala y la disminución de las deformaciones. El aumento de la proporción de acero de refuerzo para esfuerzo cortante (ρv) produce un aumento muy pequeño de la distribución de las deformaciones longitudinales, de la anchura efectiva del ala y de la disminución de las deformaciones, por lo que los efectos de este parámetro son muy pequeños y pueden despreciarse. Por último, el aumento de la proporción de acero de refuerzo del ala (ρf) conduce a un aumento de la distribución de la deformación longitudinal y de la anchura efectiva del ala y a una disminución de la deformación.
Palabras clave: Vigas en T de Arido Grueso Reciclado; Anchura Efectiva del Ala; Proporciones de Acero de Refuerzo; Distribución Longitudinal de la Deformación; Anchura Efectiva del Ala.
INTRODUCTION
A concern over sustainable construction practices has greatly increased at the expense of our high raw material usage in the construction sector in the future, becoming one of the primary causes of environmental harm, pollution of the earth, and the depletion of the planet's natural and mineral resources. Utilizing recycled aggregate might, therefore, be one of the key initiatives in achieving sustainable construction.(1) This is because the construction industry produces a lot of waste and consumes many natural resources.(2) Recycled aggregate concrete (RAC) contains hardened parts adhered (cement mortar) to the surface of natural coarse aggregate (NCA), and cement mortar has a higher porosity, greater absorbs water capacity, and lower strength. Therefore, using waste concrete as recycled aggregate resolves not only the depletion of natural resources problem but also the problem of the leftover disposal concrete that occupies the land.(3) The T-beam structural element made of reinforced concrete is divided into two portions: the vertical lower portion that withstands the tension of the beam is called a web or stem, and the upper horizontal portion that withstands the compression is called a flange and is capable of withstanding heavy loads due to internal reinforcement steel or resistance within the beam.(4) The T-beam is like the first bridge built by humans, complete with a pier and deck. A T-beam is essentially nothing more than a pillar with a horizontal bed on top or, in the case of the inverted T-beam, on the bottom.(5) The effective flange is the portion of the slab that contributes to the strength of the beam.(6) The real distribution of variable stresses on the width of the overall flange can be redistributed and made to be distributed in a uniform shape and equal to the maximum real stress distribution and the dependent flange effective width according to uniform stress distribution in procedures used in design.(7,8) The effective width is defined as the width of a hypothetical flange that compresses uniformly across its width by the same amount as the loaded edge of the real flange under the same edge shear forces. Instead, the effective width can be used as the width of the theoretical flange, which carries a compression force with uniform stress of magnitude equal to the peak stress at the edge of the simple wide flange when carrying the same total compression force.(9) The effective flange width can be calculated from equation 1, and figure 1 shows the real behavior of longitudinal strain distribution, equivalent distribution and effective width of T-beams.
![]()
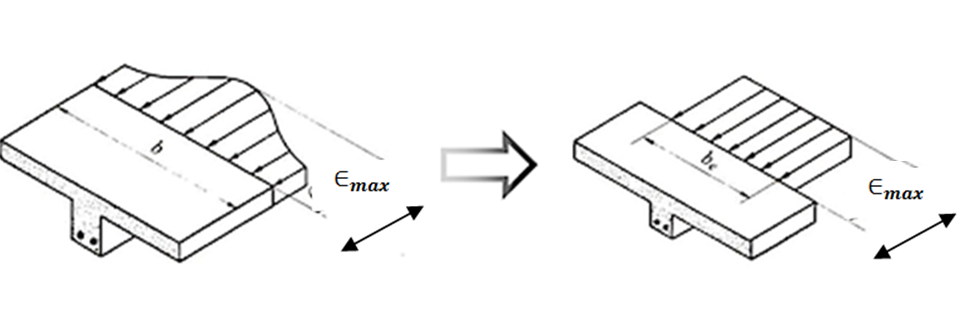
Figure 1. Real behavior of longitudinal strain distribution, equivalent distribution and effective width of T-beams.(9)
bf = width of flange. be = Effective of flange width. ϵz = longitudinal strain distribution on the top surface of the flange. ϵzmax = max longitudinal strain distribution.
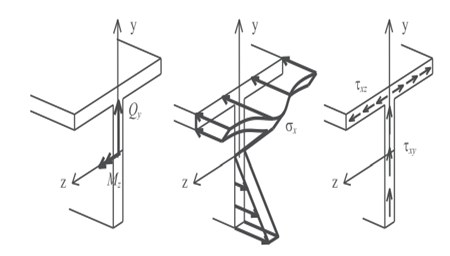
Figure 2. Stress distribution and shear lag effect(10)
The effect of shear lag can be defined as non-uniform of normal stress distribution within sections of wide flanges beam. Shear lag is a product of the interaction between normal stresses and tangential stresses or correspondingly by the effect of shear strains on longitudinal strains, and codes existing now provide practice simplified ways to treat shear lag, and this way is known by the effective width concept.(10) As shown in figure 2.
Research significance
The basic idea of the research is to use 100 % recycled coarse aggregate (RCA) instead of natural coarse aggregate (NCA) to preserve and sustain the environment and to study the effect of recycled coarse aggregate on the mechanical properties, especially compression strength, distribution of longitudinal strains on the top surface of the flange, calculating the effective width of the flange, and the effect on deflection and flexural strength performance. Also studying the effect of increasing the ratios of flexural, shear, and flange reinforcement for T-beam with cast with concrete containing 100 % RCA and knowing their effect on the distribution of longitudinal strains on the top surface of the flange, calculating the effective width of the flange, and the effect on deflection and flexural strength performance.
Experimental program
In this research, seven beams were cast and tested to study and find effects on the width of the effective flange, distributions of longitudinal strains on the top surface of the flange and deflections at mid-span. The variables are (increasing the flexural reinforcing ratio (ρw), increasing the shear reinforcing ratio (ρv), and increasing the flange reinforcing ratio (ρf)).
Properties of materials
Cement
In this work locally made cement was used Ordinary Portland Cement (OPC) type (Mass) and conforming to Iraqi standard No.5 1984.(11)
Fine aggregate (sand)
Sand (Natural fine aggregate) used in this work is from the AL-Ukhaider area in governorate Karbala. The sieve analysis for the sand (fine aggregate) is within (zone II) according to the requirements of the Iraqi specification No.45/1984.(12)
Coarse aggregate
Natural coarse aggregate (NCA)
Coarse aggregate used in this work from the AL-Nibaee region in AL-Anbar, with a max size of 19 mm. Table 1 shows the grading of crushed gravel (natural coarse aggregate) and conforms to Iraqi Standard Specification No.45:1984.(12)
|
Table 1. Grading of natural coarse aggregate (NCA) |
|||
|
GRADING |
|||
|
Sieve analysis |
Passing by weight % |
the Iraqi Specification Limits No.45/1984 |
|
|
37,5 |
100 |
100 |
ZONE (5-20) |
|
20 |
100 |
90-100 |
|
|
12,5 |
60,9 |
40-80 |
|
|
9,5 |
41,3 |
30-60 |
|
|
4,75 |
3,6 |
0-10 |
|
Recycled coarse aggregate (RCA)
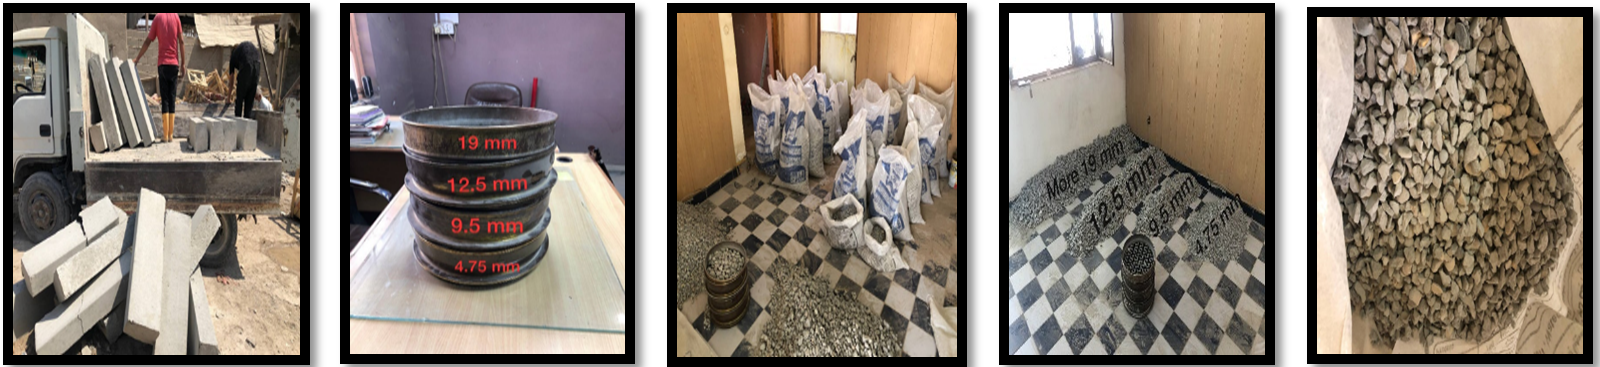
Figure 3. Explains the source and steps of recycled coarse aggregate production
The source of recycled coarse aggregate in this work is damaged pieces of curbstone that were taken from curbstone factoring in Baghdad City, where these damaged pieces are considered concrete waste that must be treated and disposed of. They were transported to the crushing machine to be crushed into small pieces and then gradated according to the required gradation, similar or close to that of the natural coarse aggregates (NCA), using a set of sieves as shown in table 2 and then washed, dried, and kept in bags. Figure 3 showed process for production of Recycled coarse aggregate (RCA).
|
Table 2. Grading of recycled coarse aggregate (RCA) |
|||
|
GRADING |
|||
|
Sieve analysis |
Passing by weight % |
the Iraqi Specification Limits No.45/1984 |
|
|
37,5 |
100 |
100 |
ZONE (5-20) |
|
20 |
100 |
90-100 |
|
|
12,5 |
52,55 |
40-80 |
|
|
9,5 |
39,6 |
30-60 |
|
|
4,75 |
2,77 |
0-10 |
|
Water
Tap water was used in the concrete mixing process and curing after hardening.
Steel reinforcement
Deformed steel bars in diameter (8, 10, 16, and 20) mm were used for reinforced beam specimens, and samples of all steel bars were tested in the material Lab. of civil engineering at the University of Technology (UOT) according to ASTM A370,(13) and the result is shown in table 3.
|
Table 3. Mechanical properties of tested reinforcing bars |
||||
|
Bars dia. |
Actual bars dia. |
Yield Stress (MPa) |
Ultimate stress (MPa) |
Elongation (%) |
|
8 |
7,85 |
540 |
623 |
8,5 |
|
10 |
9,55 |
581 |
679 |
16,5 |
|
16 |
15,83 |
575 |
665 |
22 |
|
20 |
19,73 |
581 |
672 |
24,1 |
Concrete mixing ratios
The proportions of concrete mixtures that were used in casting concrete T-beams in this research are shown in table 4.
|
Table 4. Concrete mixture components |
|||||
|
No. |
Cement (Kg/m3) |
Fine aggregate |
Coarse aggregate |
Water (L/m3) |
|
|
Sand (Kg/m3) |
NCA (Kg/m3) |
RCA (Kg/m3) |
|||
|
1 |
400 |
850 |
1050 |
0 |
180 |
|
2 |
400 |
850 |
0 |
1050 |
180 |
Mechanical properties of concrete
Control samples (cylinders, cubes, and prisms) were cast and cured for 28 days, according to(14) standard tests for cylinders, cubes, and prisms are as follows: compressive strength (f′c) for cylinders tested according to(15) and average result from the test of three cylinders in dimensions (150 mm diameter and 300 mm height) and compressive strength (fcu) for cubes tested according to(16) and average result from the test of three-cubes in dimensions 150 mm, splitting tensile strength (fsp) was tested according to(17) average result from test three-cylinders in dimensions (150 mm diameter and 300 mm height), modulus of rupture (fr) was tested according to(18) average result from test of three prisms in dimension (100 x 100 x 400) mm, and for modulus of elasticity (Ec) test was according to(19) average result from test of three-cylinders with dimensions (150 mm diameter and 300 mm height) table 5 shows the mechanical properties results for samples.
|
Table 5. Mechanical of concrete mixture properties |
||||||
|
No. of mixture |
f′c (MPa) |
fcu (MPa) |
f′c/fcu |
fsp (MPa) |
fr (MPa) |
Ec (GPa) |
|
1 |
30,33 |
36,55 |
0,83 |
3,2 |
3,59 |
26,03 |
|
2 |
25,46 |
31,05 |
0,82 |
2,76 |
2,99 |
23,95 |
Test beam specimens
In this research, Eight T-beam specimens were cast, and these beams were divided into four groups according to parameters, as shown in table 6. Details of these T-beam specimens include the following: (i) The geometry details are the same for all beams, where the cross-sections of T-beams for flange dimensions are (350 mm width and 50 mm thickness), dimensions of web are (180 mm width and 300 mm height), the total height of the beam is (350 mm), the total length of the beams is 1700 mm, and the clear span is 1500 mm, all these details shown in figure 4. (ii) steel-reinforced details are different according to the ratio of steel reinforcement, as shown in table 6. For the control beam, the steel reinforcement for the web is one layer (2Ø20 mm and 1Ø16 mm), and the steel reinforcement for the flange is 4Ø8 mm. The steel reinforcement for stirrups is (Ø10 mm @ 75 mm c/c). The concrete cover is 25 mm for all sides of the beams, and the details for dimensions and steel reinforcement for these beams are shown in figure 4.
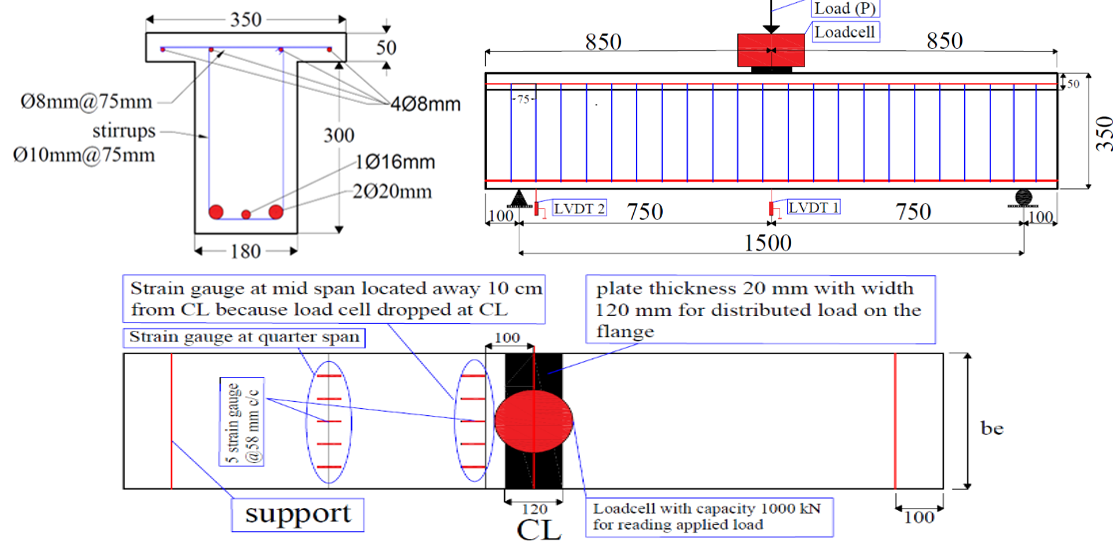
Figure 4. Details of the beam specimen (all dimensions in mm)
|
Table 6. Beam specimen details for steel reinforcement ratio and percentage of (RCA) |
||||||
|
Group |
No. |
% RCA |
ρw |
ρv |
ρf |
Note |
|
A |
A1 |
0 % RCA |
0,01439 |
0,00273 |
0,00175 |
Control |
|
A2 |
100 % RCA |
0,01439 |
0,00273 |
0,00175 |
||
|
B |
B1 |
100 % RCA |
0,01789 |
0,00273 |
0,00175 |
+25 % ρw |
|
B2 |
100 % RCA |
0,02138 |
0,00273 |
0,00175 |
+50 % ρw |
|
|
C |
C1 |
100 % RCA |
0,01439 |
0,00273 |
0,00175 |
Ø10@50 |
|
C2 |
100 % RCA |
0,01439 |
0,03927 |
0,00175 |
Ø12@75 |
|
|
D |
D1 |
100 % RCA |
0,01439 |
0,00273 |
0,00273 |
+50 % ρf |
|
D2 |
100 % RCA |
0,01439 |
0,00273 |
0,00349 |
+100 % ρf |
|
Setup test and instrumentation
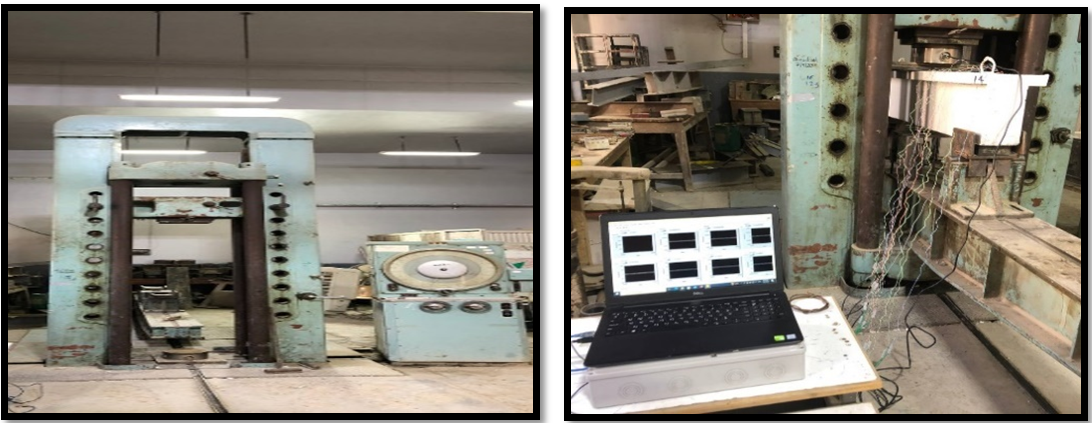
Figure 5. The test machine for applied load, data logger device
The static load was applied by a one-point concentrated load, and this load was applied by a universal test machine (AVERY) with a capacity of 2 500 kN. The beams are supported from each side at a distance of 100 mm, where one support is a hinge and the other is a roller. The rate of applied load is 50 kN/min, and this rate for loading speed is suitable for observing the cracks that appear during the loading process. The loading rate of all tested beams was equal. Two linear voltage differential transformers (LVDTs) were used, one placed in the mid-span and the other near the support, to measure the deflection of the beam at each increase in applied load. Additionally, ten strain gauges are placed on the top surface of the flange beam; 5 strain gauge@ 58 mm c/c are placed in the mid-span, and the other five strain gauge@ 58 mm c/c are placed in the quarter-span. A loadcell is positioned between the point load and the beam specimen to measure the applied load, where the diameter of the loadcell is 280 mm. Therefore, put a plate with dimensions 120 mm width, 350 mm length and 20 mm thickness to ensure that the applied load is concentrated as much as possible and distributed over the entire width of the flange. The data logger system, which was utilized to record all readings for the instruments used during the loading process, recorded all of these readings. The surface of the beam specimens was marked with all cracks that developed during the loading process, along with the amount of load that developed at each crack. All these details above are shown in while figure 5 shows the machine used in the test, data logger device.
Test results and dissections
The average compressive strength (f′c) for the control beam (A1) with 0 % RCA was (30,33 MPa), and for all other beams with 100 % RCA was (25,46 MPa), observed from these results, the compressive strength decreases in percentage 16,06 % when replacing 100 % RCA and for other machinal properties shown in table 5 the splitting tensile strength (fsp) decrease in percentage 13,75 %, modulus of rupture (fr) decreases in percentage 16,71 % and for modulus of elasticity (Ec) decrease in percentage 7,99 %. The main reason that led to this decrease in mechanical properties is the nature of the recycled coarse aggregate, which is less hard, less dense, and more porous and contains three interface transition zones (ITZ), which are considered the weakest zones in concrete. All beams with different parameters are tested to record and observe the following results: longitudinal strain distribution on the top surface of the flange, cracks patterns, failure modes, and the load-deflection curve relationship in midspan. Table 7 shows the cracking load (Pcr), yielding load (Py), ultimate load (Pu), the effective width of the flange (be), deflection at the first crack load (Δcr), yielding load (Δy) and failure load (Δu).
|
Table 7. Test results for T-beams |
||||||||||
|
Group |
Beam |
Pcr (kN) |
Δcr (mm) |
Py (kN) |
Δy (mm) |
Pu (kN) |
Δu (mm) |
Pcr/Pu |
be1 (mm) |
be / bf |
|
A |
A1 |
160 |
2,1 |
430 |
6,7 |
500 |
20 |
0,320 |
270 |
0,771 |
|
A2 |
135 |
2,99 |
416,17 |
7,68 |
470 |
25,1 |
0,287 |
253,9 |
0,725 |
|
|
B |
B1 |
160 |
1,95 |
428,01 |
5,78 |
500 |
18,22 |
0,320 |
274,52 |
0,784 |
|
B2 |
170 |
1,88 |
453,38 |
5,07 |
515 |
16,16 |
0,330 |
286,61 |
0,819 |
|
|
C |
C1 |
145 |
3,22 |
416,81 |
7,87 |
475 |
22,1 |
0,305 |
258,55 |
0,739 |
|
C2 |
135 |
2,4 |
413,32 |
7,54 |
475 |
23,74 |
0,284 |
255,66 |
0,730 |
|
|
D |
D1 |
140 |
2,17 |
438,64 |
7,36 |
475 |
20,9 |
0,295 |
264,82 |
0,757 |
|
D2 |
145 |
2,14 |
443 |
7,1 |
485 |
19,65 |
0,299 |
269,30 |
0,769 |
|
|
1be: - effective flange width, bf: - flange width equal to 350 mm |
||||||||||
Longitudinal strain distribution
The distribution of longitudinal strain on the top surface of the flange for all tested beams is shown in figure. (6,7,8 and 9), where the longitudinal strain is drawn with the width of the flange for four groups and all beams in the groups that are compared with the control beam. Each Figure has four parts (A, B, C, and D) for each group. Each part explains longitudinal strain distribution according to the two categories: (i) the first is at the first crack load or ultimate load, and (ii) the second is for the location of the strain gauge either at the quarter or mid-span. The two beams in group A (A1 and A2) are compared with us, as shown in figure 6.
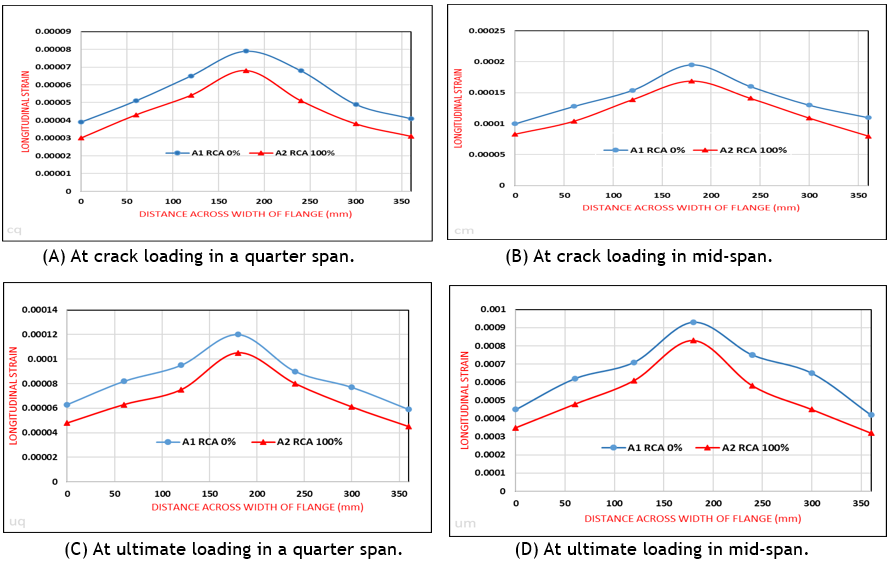
Figure 6. The longitudinal strain distribution on the top surface of the flange for beams A1 and A2
The comparison of the results in table 7 and the curves in figure 6 for beams (A1 and A2) indicates that the replacement NCA with 100 % RCA leads to a decrease in the longitudinal strain distribution of flange at mid and quarter-span in percentage 19,24 %, and a decrease in the effective flange width in percentage 5,96 %. The main reason for this decrease is the effect of replacing natural coarse aggregate (NCA) with 100 % recycled coarse aggregate (RCA), which affects the mechanical properties of the concrete and works to reduce them, especially the compressive strength, which makes the concrete less hard, and this leads to the failure of the concrete T-beam with less flexural strength. Where the recycled coarse aggregate (RCA) has a lower density and higher porosity.
The two beams in group B (B1 and B2) are compared with the control beam (A2) in group A, as shown in figure 7.
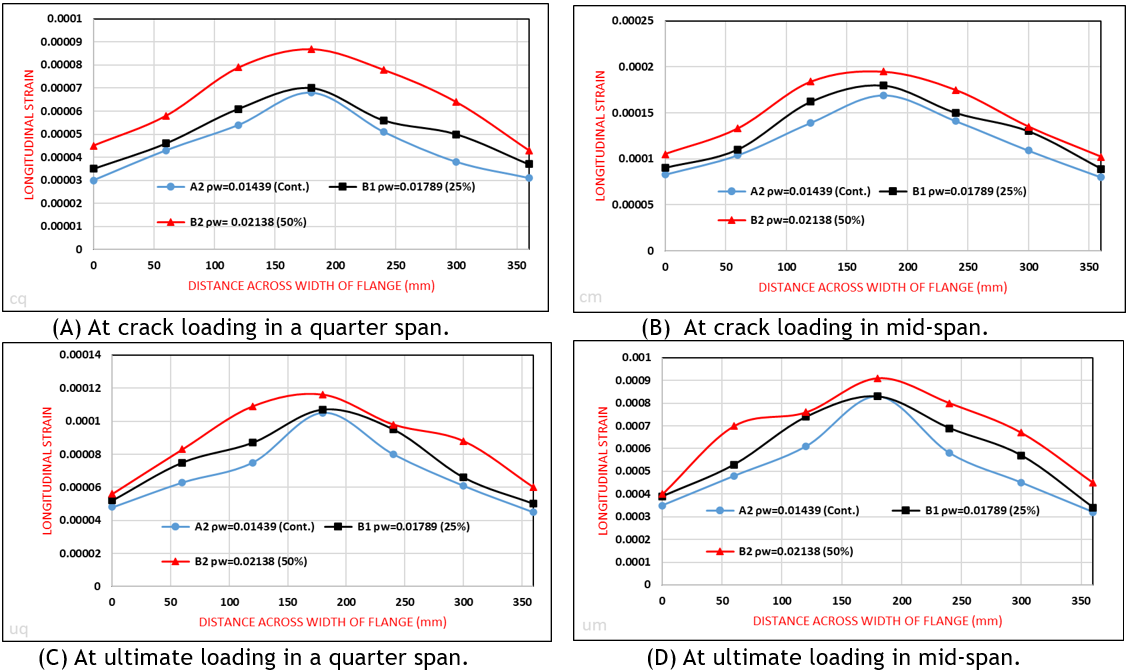
Figure 7. The longitudinal strain distribution on the top surface of the flange for A2, B1, and B2
The comparison of the results in table 7 and the curves in figure 7 for beams (A2, B1, and B2) indicates that the increase in the flexural reinforcing ratio (ρw) leads to an increase in the longitudinal strain distribution of flange at mid and quarter-span and an increase in the effective flange width according to the ratio of increase. By comparing (A2 and B1) and (A2 and B2), it is found that the increase in the percentage of longitudinal strain distribution is 12,60 % and 32,96 %, respectively. Also, the effective flange width increased by 8,12 % and 12,88 %, respectively. The reason for this increase in the longitudinal strain on the top surface of the flange and the effective width of the flange is due to the increase in the flexural strength of the beam. The increase in the flexural reinforcement ratio requires a higher applied load to reach yield and fail, and this leads to more longitudinal strain on the top surface of the flange.
The two beams in group C (C1 and C2) are compared with the control beam (A2) in group A, as shown in figure 8.
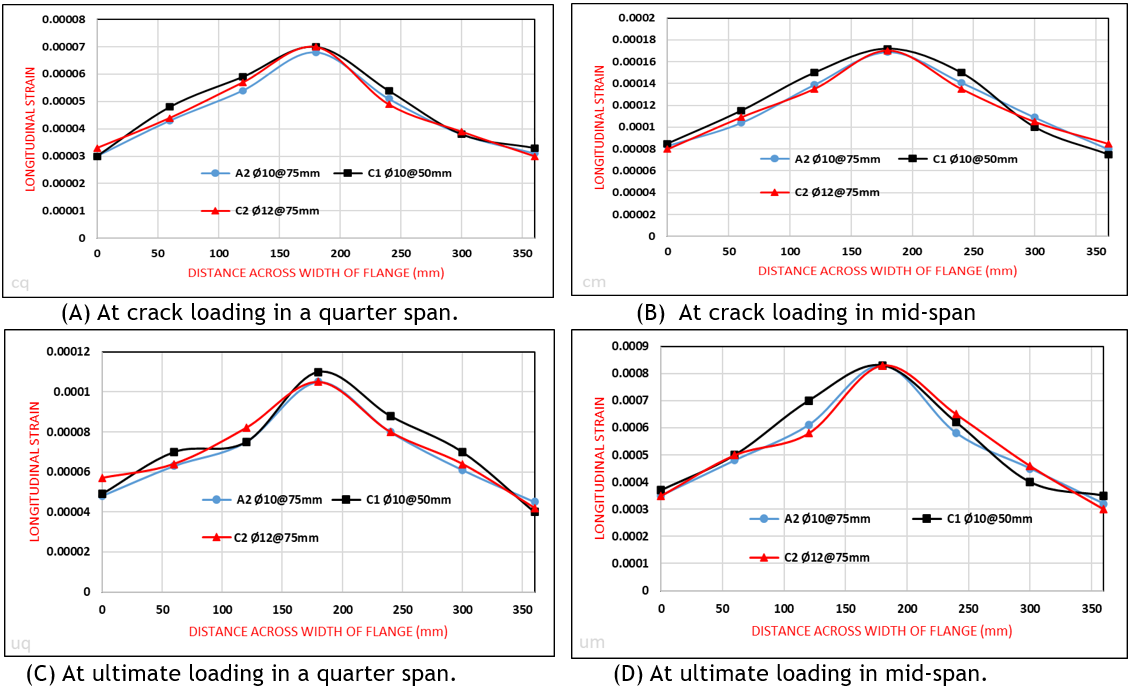
Figure 8. The longitudinal strain distribution on the top surface of the flange for A2, C1, and C2
The comparison of the results in table 7 and the curves in figure 8 for beams (A2, C1, and C2) indicates that the increase in shear reinforcing ratio (ρv) leads to very little increase in the longitudinal strain distribution of the flange at mid and quarter-span and also very little increase in the effective flange width according to the ratio of increase. By comparing (A2 and C1) and (A2 and C2), it is found that the increase in percentage of longitudinal strain distribution is 4 % and 1,74 %, respectively. Also, the effective flange width increased by 1,83 % and 0,69 %, respectively. The effect of this increase is very little, and it can be a neglected effect. This is because all T-beams are designed to fail in bending, so adding more shear steel reinforcements has no direct effect on the strength of concrete T-beams, which makes the effect small or negligible.
The two beams in group D (D1 and D2 are compared with the control beam (A2) in group A, as shown in figure 9.
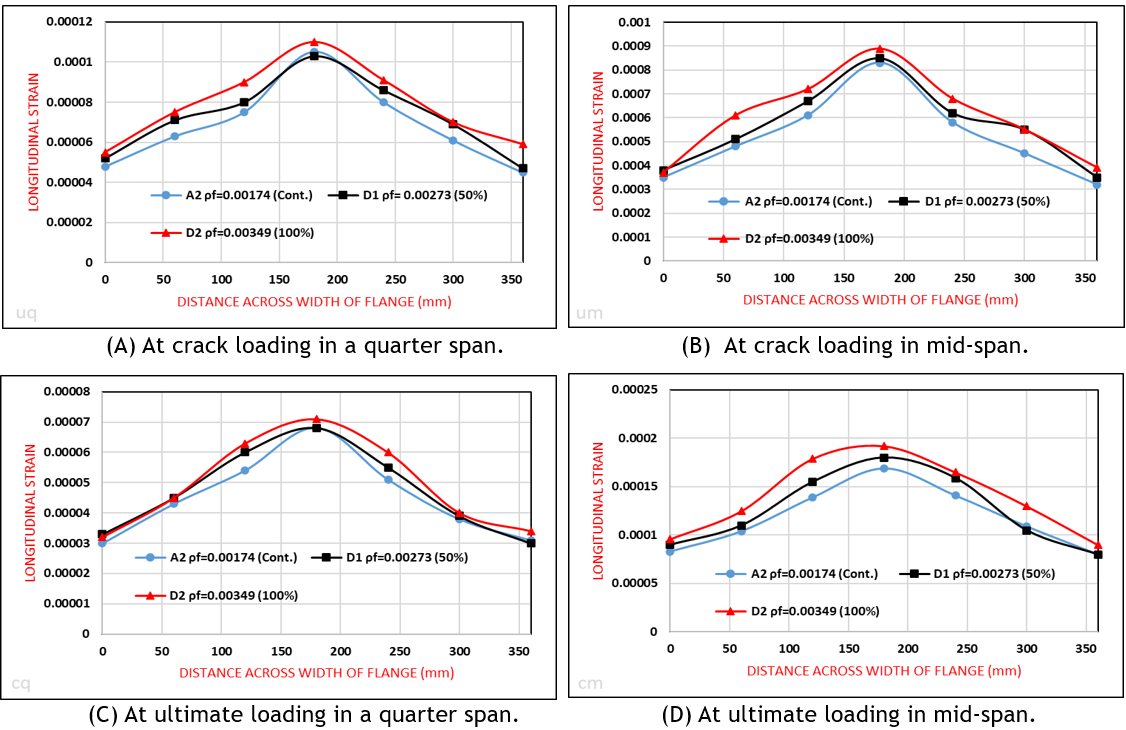
Figure 9. The longitudinal strain distribution on the top surface of the flange for A2, D1, and D2
The comparison of the results in table 7 and the curves in figure 9 for beams (A2, D1, and D2) indicates that the increase in the steel reinforcement flange ratio (ρf) leads to an increase in the longitudinal strain distribution of the flange at mid and quarter-span and increase in the effective flange width according to the ratio of increase. By comparing (A2 and D1) and (A2 and D2), it is found that the increase in the percentage of longitudinal strain distribution is 6,81 % and 15,34 %, respectively. Also, the effective flange width increased by 4,3 % and 6,07 %, respectively. The reason for this increase is that the flange reinforcement contributes to providing additional compressive resistance to the concrete section in the compression zone, and this leads to a reduction in the concrete compression zone, which leads to an increase in the longitudinal strains on the top surface of the flange and thus increasing the effective width of the flange.
Load-deflection relationship
Load-deflection curves for all beams in groups are shown in figure 10 and compared with the control beam. Table 7 shows deflection in midspan at stages of load (i) first crack load (Pcr), (ii) yielding load (Py), and (iii) ultimate load (Pu) for all tested beams. The behavior of beams exhibited similar stages where, before first cracking, they were stiff. After the first crack, they were less stiff until the steel-reinforced beam reached the yield point. After these stages, a slight increase in load with more deflection was recorded.
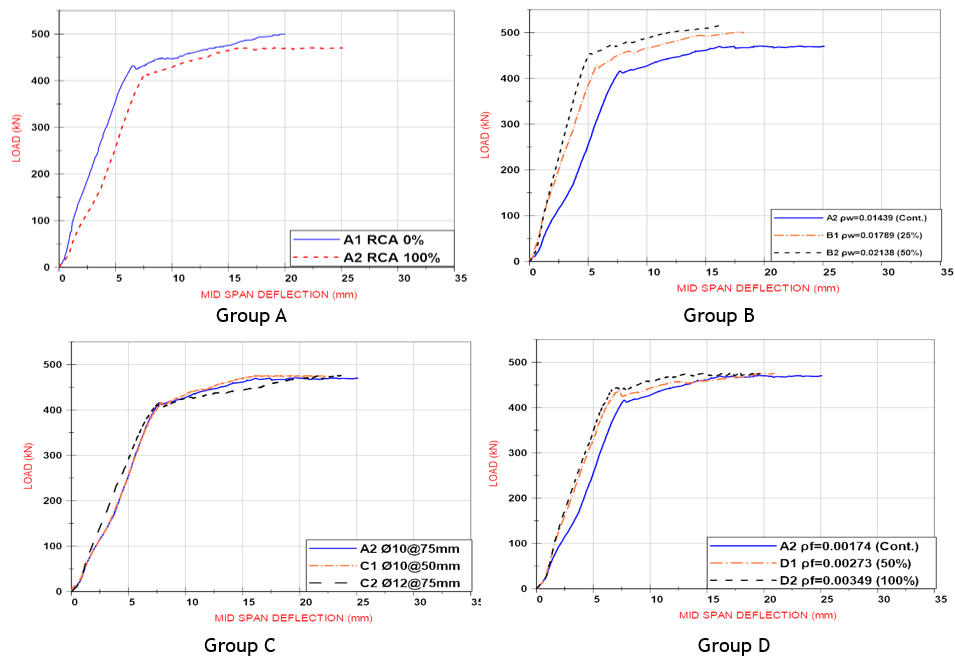
Figure 10. The load-deflection curves for all beams
For group A, which has two beams (A1 and A2), the beams are compared with us, as shown in figure 10. It can be concluded that replacing NCA with 100 % RCA leads to an increase in deflection at the same applied load, where yielding loads decrease in percentage by 3,26 %, and deflection increases in percentage by 14,93 % and ultimate load decreases in percentage 6 % and deflection increase in percentage 25,5 %. This is due to the fact that recycled coarse aggregate (RCA) is less hard, less dense, and higher in porosity than natural coarse aggregate (NCA), which leads to a decrease in flexural strength and an increase in deflection.
For group B, which has two beams (B1 and B2), the beams are compared with the control beam (A2), as shown in figure 10. It can be concluded that an increase in the percentage of steel reinforced ratio for flexural (ρw) leads to a decrease in deflection at the same applied load, where yielding loads increase in the percentage of 2,88 % and 8,89 %, respectively, and deflection decreases in the percentage of 24,94 % and 34,16 %, respectively. Also, the ultimate load increased in percentage by 6,38 % and 9,57 %, respectively, and deflection decreased in percentage by 27,41 % and 35,62 %, respectively. The reason for the increase in applied load and the decrease in deflection is due to the increase in tensile strength through an increase in the percentage of steel-reinforced ratio for flexural (ρw).
For group C, the two beams (C1 and C2) are compared with the control beam (A2). As shown in figure 10. It can be concluded that an increase in the percentage of steel-reinforced ratio for shear (ρv) leads to very little effect and can be neglected. This is because increasing the shear reinforcement does not effect on the tensile strength; therefore, it does not have a noticeable effect on the deflection, and its effect can be neglected.
For group D, the two beams (D1 and D2) are compared with the control beam (A2). As shown in figure 10. It can be concluded that an increase in the percentage of steel reinforced ratio for flange (ρf) leads to a decrease in deflection at the same applied load, where yielding loads increase in the percentage of 5,29 % and 6,49 %, respectively, and deflection decreases in the percentage of 4,42 % and 7,79 %, respectively. Also, ultimate load increased in percentage by 1,06 % and 3,19 %, respectively, and deflection decreased in percentage by 16,73 % and 21,71 %, respectively. The reason for the increase in the applied load and the decrease in deflection is due to the increase in compression reinforcement, as the behavior of the steel reinforcement in tension and compression is similar, which leads to an increase in the resistance of the T-beam to compression and a reduction in deflection.
Mode of failure
All concrete T-beams in this research were designed to fail in flexural mode, as when the applied load gradually increases, cracks begin to appear in the mid-span of the T-beam and gradually spread and expand towards the flange and supports, where all beams fail in flexural mode, as shown in figure 11.
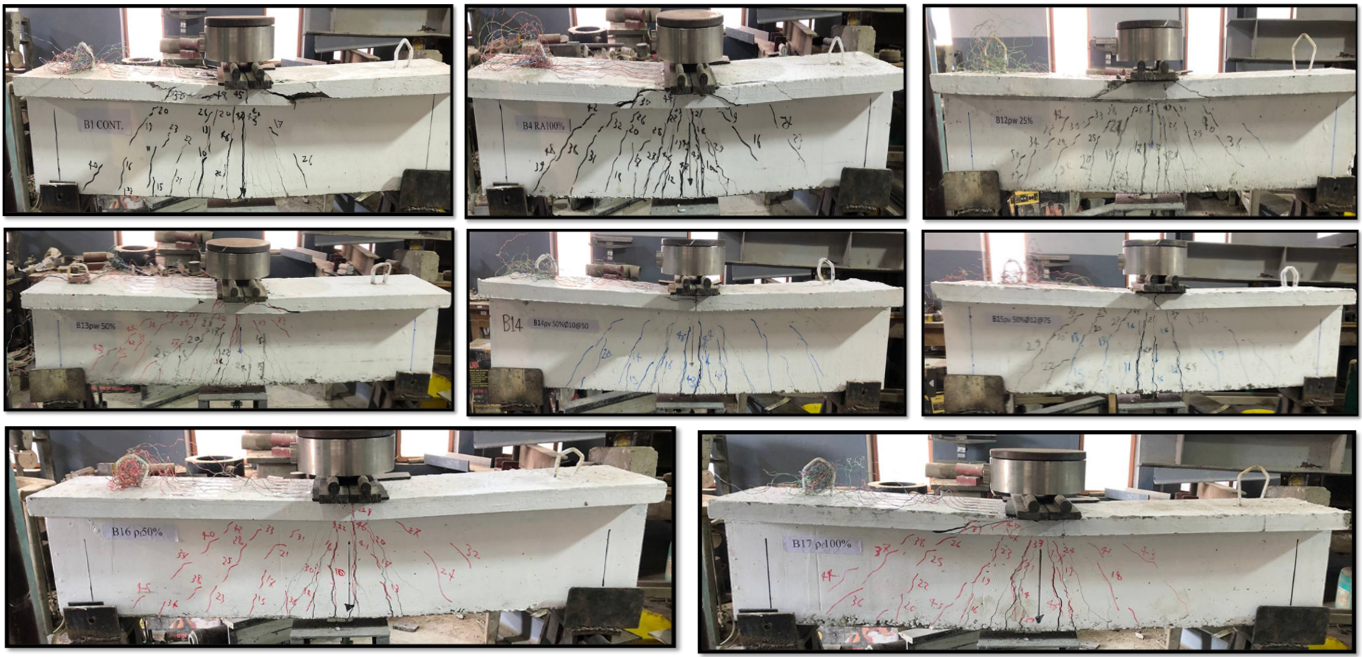
Figure 11. Cracks patterns with the applied load and mode failure
Pre-cracking stiffness
According to K-Fahmy et al.(20) the pre-cracking stiffness (Ki) can be found by using the equation Ki=Pcr/Δcr. Table 7 shows the load of cracking (Pcr) and the displacement corresponding (Δcr) for all beams. From load-deflection curves, the pre-cracking stiffness (Ki) for beams (A1 and A2) is equal to (76,19 and 45) kN/mm, respectively, and from the comparison beam (A2) with control beam (A1), the pre-cracking stiffness decreased in a percentage by 40,94 %, the reason for this decrease is the effect of recycled coarse aggregate (RCA) on the mechanical properties of concrete and reducing them. For beams (B1 and B2), it is equal to (82,05 and 90,43) kN/mm, respectively, and from the comparison of beams in group (B) with the control beam (A2), the pre-cracking stiffness increased in percentage by 81,73 % and 100 %, respectively, the reason for this increase is due to the increase in tensile strength through an increase in the percentage of steel reinforced ratio for flexural (ρw). For beams (C1 and C2), the pre-cracking stiffness (Ki) equals (45,03 and 56,25) kN/mm, respectively, and from a comparison of these beams with the control beam (A2), the pre-cracking stiffness is still the same in beam (C1), and there is an increase in the percentage of 24,58 % for beam (C2). Finally, for beams (D1 and D2), the pre-cracking stiffness (Ki) equals (64,52 and 67,89) kN/mm, respectively, and from compared with the control beam (A2), the pre-cracking stiffness increases by 42,9 % and 50,37 %, respectively, the reason for this increase is due to the increase in compression reinforcement, as the behavior of the steel reinforcement in tension and compression is similar, which leads to an increase in the resistance of the T-beam in compression strength and a reduction in deflection.
Development patterns of cracks
The increase in the applied load leads to the appearance of cracks, expansion, and an increase in number. It is very important to know the amount of load and the location of the first crack. In this work, it is observed that the first cracks are observed in the zone of pure flexural. For the control beam (A1), the first crack appeared at load 160 kN, and for beam (A2), the first crack load decreased in percentage by 15,63 %; this is due to the decrease in mechanical properties of concrete containing 100 % recycled coarse aggregate. For beams (B1 and B2), when compared with the control beam (A2), the first crack load increased by 18,52 % and 25,93 %, respectively; this is due to the increase in tensile strength by increasing the flexural reinforcement. For beams (C1 and C2), when compared with the control beam (A2), the first crack load for beam (C1) increased in percentage by 7,4 % and was still the same for beam (C2); this is due to reducing the distances between the stirrups from (75 to 50) mm c/c, and this prevents or hinders some cracks from appearing. Finally, for beams (D1 and D2), when compared with the control beam (A2), the first crack load increased by 3,7 % and 7,4 %, respectively, because the strength of the compression zone is increased by increasing the flange reinforcement. Beyond the load of the first crack, the load increased more, leading to the development of many new cracks and widening, propagating cracks towards the supports and upward to the flange. Figure 11 showed a crack pattern with the applied load.
Evaluation and comparison of flexural strength for beams
The assumptions of the ACI 318-19(21) code used in the theoretical analysis indicate that the experimental ultimate load (Pexp.) results are higher than the nominal (Pn) results for all tested beams, and this is tributed, for the following assumptions: (1) linear strain distribution in all depths of the beam, (2) perfect bond between steel reinforcement and surrounding concrete, (3) neglect of the contribution of cracked concrete tensile. (4) The stress-strain curve behavior of the steel reinforcement is assumed to be bilinear (elastic-perfectly plastic), (5) the strain at ultimate compressive is 0,003 mm/mm, and the calculated flexural strength for cross-section was for all tested beams at this strain, (6) the stress distribution at the compression side of the beam was a rectangular block (average maximum stress equal to 0,85 of the compressive strength), and (7) the steel hardening was not considered in the analysis. The nominal (Pn.) and experimental (Pexp.) flexural strengths are shown in table 8.
|
Table 8. The nominal (Pn.) and experimental (Pexp.) flexural strength |
|||
|
Beams |
Pn (kN) |
Pexp. (kN) |
Pn / Pexp. |
|
A1 |
361 |
500 |
0,72 |
|
A2 |
344 |
470 |
0,73 |
|
B1 |
420 |
500 |
0,84 |
|
B2 |
478 |
515 |
0,93 |
|
C1 |
344 |
475 |
0,72 |
|
C2 |
344 |
475 |
0,72 |
|
D1 |
344 |
475 |
0,72 |
|
D2 |
344 |
485 |
0,71 |
CONCLUSIONS
From the results of the beams, many conclusions are drawn and summarized below:
1- Replacing natural coarse aggregate (NCA) with 100 % recycled coarse aggregate (RCA) leads to a reduction in all mechanical properties as shown in the following percentages: the compressive strength decreased by a percentage 16,06 %, splitting tensile strength (fsp) decreased by a percentage 13,75 %, modulus of rupture (fr) decreased by a percentage 16,71 %, and modulus of elasticity (Ec) decreased by a percentage 7,99 %.
2- The mode of failure for all tested beams was flexure mode.
3- All cracks start from the middle toward the supports, and with the increase in load, the crack number, crack spacing, appearance of new cracks, and crack propagation all increase.
4- When the percentage of recycled coarse aggregate (RCA) increases, the first cracks appear under less applied load, and when the percentage of steel reinforcement ratio increases, the first cracks appear under more applied load.
5- The deflection increases with increases in the percentage of recycled coarse aggregate (RCA) and decreases with an increase in the steel reinforcing ratio for all tested beams.
6- The increase in the percentage of recycled coarse aggregate (RCA) and the increase in steel reinforcement ratio effect on the distribution of longitudinal strain and effective flange width for all beam specimens as follows:
A- For beam (A2), when replacing natural coarse aggregate (NCA) with 100 % recycled coarse aggregate (RCA) leads to a decrease in the longitudinal strain distribution of the flange when compared with the control beam (A1) in percentage 19,24 % and a decrease in the effective width of the flange in percentage 5,96 %.
B- For group B, with an increase in the percentage of flexural reinforcing ratio (ρw) for beams (B1 and B2), the longitudinal strain distribution of the flange increased when compared with the control beam (A2) by 12,60 % and 32,96 %, respectively, and the effective width of the flange increased by 8,12 % and 12,88 %, respectively.
C- For group C, with an increase in the percentage of shear reinforcing ratio (ρv) for beams (C1 and C2), the longitudinal strain distribution of the flange increased when compared with the control beam (A2) by 4 % and 1,74 %, respectively, and the effective width of the flange increased by 1,83 % and 0,69 %, respectively. This parameter has very little effect, and it can be neglected.
D- For group D, with an increase in the percentage of flange reinforcing ratio (ρf) for beams (D1 and D2), the longitudinal strain distribution of the flange increased when compared with the control beam (A2) by 6,81 % and 15,34 %, respectively, and the effective width of the flange increased by 4,3 % and 6,07 %, respectively.
REFERENCES
1. Kwan, W. H., Ramli, M., Kam, K. J., & Sulieman, M. Z., Influence of the amount of recycled coarse aggregate in concrete design and durability properties, Construction and Building Materials, (2012) 26(1). https://doi.org/10.1016/j.conbuildmat.2011.06.059
2. Cachim PB., Mechanical properties of brick aggregate concrete, Constr Build Mater (2009) 23:1292–7.
3. Shi, C., Li, Y., Zhang, J., Li, W., Chong, L., & Xie, Z., Performance enhancement of recycled concrete aggregate - A review, In Journal of Cleaner Production (2016) 466–472. Elsevier Ltd. https://doi.org/10.1016/j.jclepro.2015.08.057
4. Information on https://en.wikipedia.org/wiki/T-beam#cite_note-3
5. Ambrose, James; Tripeny, Patrick, Simplified design of concrete structures (8th ed.), Chichester: Wiley. (2007) p. 104. ISBN 978-0-470-04414-8. Retrieved 26 April 2015.
6. McCormac, J.C. and Brown, R.H., Design of reinforced concrete, 2015. John Wiley & Sons
7. Shakir, H.J., Finite Element Investigation on Shear Lag in Composite Concrete-Steel Beams with Web Openings, Journal of Engineering, (2015) pp.11 33
8. Qin, X.X., Liu, H.B., Wang, S.J. and Yan, Z.H., Simplistic analysis of the shear lag phenomenon in a T-beam. Journal of Engineering Mechanics, (2015). 141(5), p.04014157.
9. Al-Sherrawi M H M and Fadhil G A, Effect of stiffeners on Shear Lag in Steel Box Girder Al-Khwarizmi Engineering Journal, (2012) Vol. 8, No. 2, pp 63-76
10. Pilar MartÃnez, E., SimÃ, M., & Bajo, C, Engineering Structures Experimental analysis of shear-lag effect in reinforced concrete T-beams, (2022).
11. Iraqi Specification Standards IQS No. 5 "Portland Cement," Central Agency for Standardization and Quality Control, Planning Council, Baghdad, IRAQ, 1984 (in Arabic).
12. Iraqi Specification Standards IQS No.45 "Aggregate from Natural Sources for Concrete and Construction," Central Agency for Standardization and Quality Control, Planning Council, Baghdad, IRAQ, 1984 (in Arabic).
13. ASTM A370, “Standard Test Methods and Definitions for Mechanical Testing of Steel Products,” ASTM International, West Conshohocken, PA, USA, pp. 1–51, 2022, doi: 10.1520/A0370-22.
14. ASTM C 192/C 192M-05"Standard Practice for Making and Curing Concrete Test Specimens in the Laboratory," Annual Book of ASTM Standards, American Society for Testing and Materials, 2005 pp. 1-8.
15. ASTM C 39/C 39M-05"Standard Test Method for Compressive Strength of Cylindrical Concrete Specimens," Annual Book of ASTM Standards, Vol. 04.02 Concrete and Aggregates, West Conshohocken, PA, United States, 2005 7 pp.
16. BS 1881-Part 116:1983"Method for Determination of Compressive Strength of Concrete Cubes," British Standards Institute BSI, London, 2000 11 pp.
17. ASTM C 496/C 496M-04"Standard Test Method for Splitting Tensile Strength of Cylindrical Concrete Specimens," Annual Book of ASTM Standards, Vol. 04.02 Concrete and Aggregates, West Conshohocken, PA, United States, 2004 5 pp.
18. ASTM C 78-02"Standard Test Method for Flexural Strength of Concrete (Using Simple Beam with Third-Point Loading)," Annual Book of ASTM Standards, American Society for Testing and Materials, 2002.
19. ASTM C 469-02, "Standard Test Method for Static Modulus of Elasticity and Poisson's Ratio of Concrete in Compression," Vol. 04.02, 2005, pp. 1-7.
20. K-Fahmy, M. F. M., & Idriss, L. K., Flexural behavior of large-scale semi-precast reinforced concrete T-beams made of natural and recycled aggregate concrete, Engineering Structures, (2019) 198. https://doi.org/10.1016/j.engstruct.2019.109525
21. ACI Committee 318 "Building Code Requirements for Structural Concrete (ACI 318-19) and Commentary", American Concrete Institute, Detroit. MI. U.S.A, 2019.
FINANCING
"The authors did not receive financing for the development of this research".
CONFLICT OF INTEREST
"The authors declare that there is no conflict of interest".
AUTHORSHIP CONTRIBUTION
Conceptualization: Ali Mohsin Razooq, Eyad Kadhem Sayhood, Ali Sadiq Resheq.
Data curation: Ali Mohsin Razooq, Eyad Kadhem Sayhood, Ali Sadiq Resheq.
Formal analysis: Ali Mohsin Razooq, Eyad Kadhem Sayhood, Ali Sadiq Resheq.
Research: Ali Mohsin Razooq, Eyad Kadhem Sayhood, Ali Sadiq Resheq.
Methodology: Ali Mohsin Razooq, Eyad Kadhem Sayhood, Ali Sadiq Resheq.
Drafting - original draft: Ali Mohsin Razooq, Eyad Kadhem Sayhood, Ali Sadiq Resheq.
Writing - proofreading and editing: Ali Mohsin Razooq, Eyad Kadhem Sayhood, Ali Sadiq Resheq.