Categoría: STEM (Science, Technology, Engineering and Mathematics)
ORIGINAL
Crop recommendation system and pest classification using weighted support vector machine on climate data
Sistema de recomendación de cultivos y clasificación de plagas utilizando máquina de vectores de soporte ponderado sobre datos climáticos
S. Kiruthika1 ![]() *, Dr.D.Karthika2
*, Dr.D.Karthika2 ![]() *
*
1Research Scholar, Department of Computer Science, P.K.R. Arts College for Women, Gobichettipalayam, Tamilnadu.
2Associate Professor & Head, School of Computer Science, VET Institute of Arts and Science (Co-education) College, Erode, Tamil Nadu, India.
Cite as: Kiruthika S, Karthika D. Crop recommendation system and pest classification using weighted support vector machine on climate data. Salud, Ciencia y Tecnología - Serie de Conferencias. 2024;3:757. https://doi.org/10.56294/sctconf2024757
Submitted: 28-12-2023 Revised: 19-03-2024 Accepted: 11-05-2024 Published: 12-05-2024
Editor: Dr.
William Castillo-González ![]()
ABSTRACT
Introduction: the primary cause of the significant decline in crop productivity is farmers’ poor crop selection. A number of pests, including weeds, insects, plant diseases, and the poisonous nature of the most current remedies, offer challenges to the current approach. Therefore, for the most effective and precise classification and recommendations, these factors should be considered together.
Methods: levy flight Grey Wolf Optimization (LGWO) and the WSVM (Weight-Support Vector Machine) method are recommended in this research for the intention of upgrading the efficiency of the system as well as resolving the above-mentioned issues. A CRS (Crop Recommendation System) utilizing the LGWO-WSVM algorithm is to be developed in order to increase crop productivity. This study’s primary stages include crop suggestion, FS (Feature selection), and pre-processing. The KNN (K-Nearest Neighbour) technique is utilized for the pre-processing of the climatic dataset in order to accommodate incorrect values and missing variables.
Results: the best fitness values are utilized to identify more pertinent weather features. These chosen qualities are then applied to the categorization phase. In order to create a system which integrates the predictions of the LGWO-WSVM model to recommend an appropriate crop depends on the kinds of the particular soil and features having greater accuracy.
Conclusion: in order to get the best recommendation outcomes, it is also utilized to categorize the pest traits. The test outcomes indicate that the recommended LGWO-WSVM strategy overtakes the current methods by accuracy, precision, recall, and execution time.
Keywords: CRS (Crop Recommendation System), Pest Classification; Levy Flight Grey Wolf Optimization (LGWO), WSVM (Weight-Support Vector Machine) Algorithm.
RESUMEN
Introducción: la causa principal de la disminución significativa de la productividad de los cultivos es la mala selección de cultivos por parte de los agricultores. Varias plagas, incluidas malezas, insectos, enfermedades de las plantas y la naturaleza venenosa de los remedios más actuales, plantean desafíos al enfoque actual. Por lo tanto, para lograr una clasificación y recomendaciones más efectivas y precisas, estos factores deben considerarse en conjunto.
Métodos: en esta investigación se recomiendan la optimización del lobo gris de vuelo de Levy (LGWO) y el método WSVM (máquina vectorial de soporte de peso) con la intención de mejorar la eficiencia del sistema y resolver los problemas mencionados anteriormente. Se desarrollará un CRS (Sistema de recomendación de cultivos) que utiliza el algoritmo LGWO-WSVM para aumentar la productividad de los cultivos. Las etapas principales de este estudio incluyen sugerencia de cultivos, FS (selección de características) y preprocesamiento. La técnica KNN (K-Nearest Neighbour) se utiliza para el preprocesamiento del conjunto de datos climáticos con el fin de dar cabida a valores incorrectos y variables faltantes.
Resultados: los mejores valores de condición física se utilizan para identificar características climáticas más pertinentes. Estas cualidades elegidas luego se aplican a la fase de categorización. Para crear un sistema que integre las predicciones del modelo LGWO-WSVM, recomendar un cultivo apropiado depende de los tipos de suelo en particular y las características que tengan mayor precisión.
Conclusión: para obtener los mejores resultados de recomendación, también se utiliza para categorizar los rasgos de la plaga. Los resultados de la prueba indican que la estrategia LGWO-WSVM recomendada supera a los métodos actuales en exactitud, precisión, recuperación y tiempo de ejecución.
Palabras clave: CRS (Sistema de Recomendación de Cultivos); Clasificación de Plagas;Algoritmo de Optimización del Lobo Gris de Vuelo de Levy (LGWO); Algoritmo WSVM (Máquina Vectorial de Soporte de Peso).
INTRODUCTION
For both the survival of humans and the Indian economy, agriculture is important. It is one of the main jobs that are necessary for human survival. It also makes a significant contribution to our daily lives.(1) Farmers typically commit suicide as a result of decreased productivity because they are unable to repay bank loans they have taken out for their operations. Despite being one of the biggest providers of crop products in the world, India, its farm production is still extremely low. In order for farmers to use less work and attain more money from the similar quantity of land, productivity must rise. An approach to it is provided by agricultural precision. The term precision farming involves adding the right amount of fertilizer, soil, manure, and other materials to the crop at the right time to boost yields and production. Not every precision agricultural system produces the greatest outcomes. However, in cultivation, it is critical that the information given be exact and accurate because mistakes could result in significant supplies and financial loss. To develop a reliable and effective system for crop prediction, numerous studies are being conducted.(2)
A farmer in the agricultural sector is constantly curious about the yield they are going to obtain. In earlier times, farmers' experiences with a particular crop and land were taken into account when making predictions about crop output for various crops. Mixed seasonal, natural, and economic factors influence crop productivity, but farmers suffer significant losses due to unpredictable fluctuations in these components. Most of the time, farmers even take their own lives as an outcome of their inability to repay bank loans obtained for farming because of decreased yields. By applying precise mathematical or statistical techniques to information regarding soil, weather, and historical production, these risks can be reduced. With the use of these techniques, farmers can be advised which crop is appropriate for their property in order to maximize profits.(2,3)
Numerous factors, including soil quality, rainfall, daylight availability, water supply, application of fertilizer, pest control, and field setup, affect crop output. One typical problem faced by Indian farmers can be stated as they select crops based on factors other than soil and climate.(4) Crop management strategies must be developed based on soil and favorable location in order to maximize production, as climate and soil characteristics directly affect crop yield.(5) There is a strong correlation between weather and agriculture, and it is imperative to adapt to changes in climatic patterns in a constructive manner. Using climate-smart agricultural practices can help increase the quality as well as productivity. The impact of severe weather on crops is summed up in earlier studies.
The CRS is depicted in figure 1.
The CRS and pest classification utilizing ML (Machine Learning) are the primary goals of this research. Even though numerous researches and tactics have been presented, there is still a considerable lack of assurance regarding classification accuracy. The current methods have shortcomings, such as subpar food crops and unreliable classification outcomes. The LGWO and WSVM algorithms have been recommended in this research to enhance the total prediction efficiency and resolve the above mentioned issues. Pre-processing, FS, and classification represent the study’s primary contributions. Using efficient algorithms, the recommended method produces findings that are more reliable for the specified climatic dataset.
The rest of the research is ordered by the following: Section 2 reviews the recent methods for FS, pre-processing and classifications for CRS. Section 3 describes the process of the suggested algorithm, Section 4 provides the results and discussions, and Section 5 deals with conclusion.
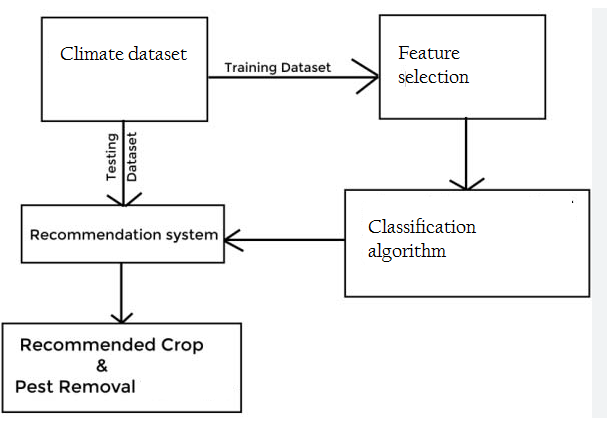
Figure 1. Crop recommendation system
Related work
Kulkarni et al.(6) that integrates the predictions of someML algorithms to highly accurately select the appropriate crop based on the particular type and attributes of the soil. In the ensemble model, NB (Naive Bayes), SVM (Linear Support Vector Machine) and RF (Random Forest) are the distinct base learners that are employed. For each classifier, an acceptable accuracy set of class labels is provided. The (Majority Voting) MVsystem is employed to combine the class labels for the base learners. Classifying the input soil dataset into the CR types, Kharif and Rabi, is done by the CRS. Together with meteorological data like typical rainfall and surface temperature readings, the dataset also includes physical and chemical properties unique to soil.
The CRS for the farmers based on the SVM technique is presented by Modi et al.(7). Analysis of the specific crop's profit is required for this work in order to boost production and prevent farmers from losing money. The SVM algorithm is implemented for classification to categorize the many soil factors and forecast the best crop. Anaconda Navigator simulates an approach to assess soil factors and suggest a crop that would be good. For classification, the SVM technique is taken into account. Calculating the accuracy and matrix of confusion allows for the algorithm's efficacy to be tested.
ML is utilized to predict 4 common yields that are cultivated mostly throughout India, as suggested by Pant et al.(8) Once the crop yield for a given site has been estimated, inputs like fertilizers can be utilized in different ways depending on the crop's expected demands and the needs of the soil. In this work, we employ ML techniques to train an algorithm that recognizes patterns in information that is applied to crop prediction. In this study, ML is used to predict the harvests of the 4 most commonly grown crops in India. Wheat, potatoes, rice (paddy), and corn are some of these crops.
Gandhi et al.(9) talked on how cereal crops like rice, wheat, and different pulses are the main sources of food supply in India. A good climate is necessary for the sustainability and production of rice-growing regions. Seasonal climate variations can be harmful, with productivity being negatively impacted by drought episodes. Improved methods for predicting agricultural yield under various climate scenarios would help farmers and other stakeholders make more informed decisions about agronomy and crop selection. The prediction of agricultural yield under various environmental conditions can be improved by using ML techniques. The usage of the ML techniques for rice cropping areas in India is reviewed in this study.
The publicly accessible Indian Government records provided the dataset that was taken into account for the rice harvest level prediction. For the Kharif season (June to November) in the years 1998 to 2002, the study's criteria included rainfall, minimum temperature, average temperature, maximum temperature, and reference crop evapotranspiration, region, production, and yield. The RRSE (Root Relative Square Error), RAE (Relative Absolute Error), RMSE (Root Mean Square Error), and MAE (Mean Absolute Error) were computed for the current investigation. The experimental findings demonstrated that other approaches performed considerably better on the similar dataset.
The characteristics of the image patches are created by alignment-pooling of features with low-level (sparse coding), that can be programmed on the basis of an existing dictionary. Xie et al.(10) (2018) discussed the characteristics of pest photographs, that are learned in an extensive number of unlabelled image patches with UFL (unsupervised feature learning) methods. The filters are employed at various scales and coupled with multiple pooling granularities to overcome the misaligned issue of patch-level features. After filtering, a multi-level classification system incorporates the patch-level features. Our multi-level learning feature-pest classification model surpasses the most advanced approaches, according to experimental data on 40 prevalent pest species in crop fields. Additionally, the influence of patch sizes and dictionary sizes are also investigated in the study, and different dictionary learning models are evaluated in the pest species classification methodology.
Crop pests have been implicated in major global economic, social, and environmental losses, according to Ullah et al.(11) Different pests require various techniques of control, and accurately predicting pests has become essential to pest management and is a major challenge in farming. DL (Deep Learning) models have showed great potential in picture recognition, which has piqued the curiosity of many specialists in agriculture. Because of the intricacy of their algorithms and the scarcity of available data, pest identification systems in the literature have comparatively low accuracy in terms of pest detection and classification. Incorrect application of pesticides due to misclassification of insect pests can have a negative impact on agricultural productivity and the environment. It demands the creation of an automated system with improved pest identification and classification capabilities. A new end-to-end DeepPestNet system for identification and classification of pests is presented in this research. Eleven learnable layers make up the framework, including 3 FC (Fully Connected) layers and 8 convolutional layers. In order to expand the dataset and assess the DeepPestNet method's generalizability, the researches employed image rotation along with augmentation methods. By evaluating the suggested DeepPestNet structure using the well-known Deng's crops data set.
Gupta et al.(12) discussed about the way in which the agriculture contributes significantly to the incomes of a large number of people worldwide. It also offers a plethora of employment opportunities to people of all backgrounds. Many farmers prefer to go back to using the outdated farming methods that don't yield much profit in the current market. A framework for ML is offered to predict crop yields. Crop data is gathered and included in the data set of an experiment. The Relief technique is then employedfor FS. The technique of linear discriminant analysis is used to extract features. For classification, 3ML predictors are employed: RF (Random Forest), PSO (Particle Swarm Optimization)- SVM, and the KNN (K-Nearest Neighbour).
METHODOLOGY
ALevy flight Grey Wolf Optimization (LGWO) and the WSVM (Weight-Support Vector Machine) algorithm have been developed for appropriate crop prediction and CRS in this study. The primary contribution of this study include pre-processing, FS, and appropriate crop prediction. The general structure of the suggested LGWO-WSVM algorithm is depicted in figure 2.
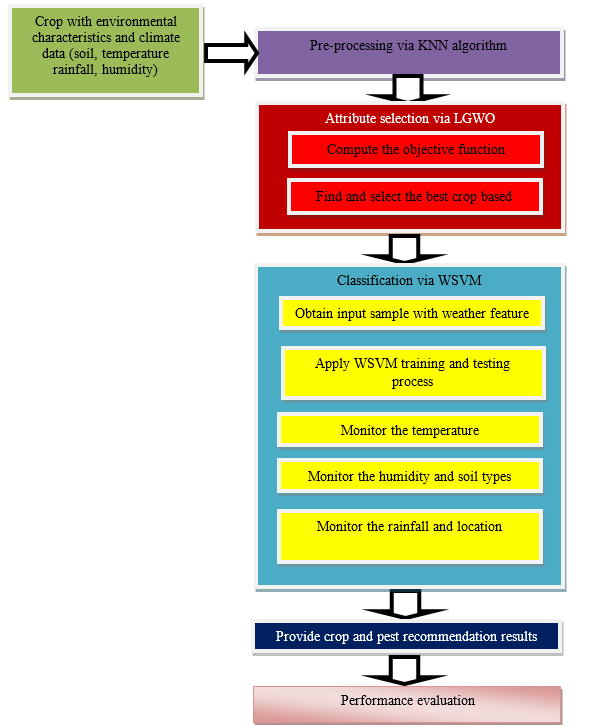
Figure 2. Overall block diagram of the proposed LGWO-WSVM algorithm
Dataset
The dataset for CR can be accessed at https://www.kaggle.com/siddharthss/crop-recommendation-dataset. The CR dataset takes into consideration the amount of crop output in a given location as well as a number of variables that determine the rain in that particular area. Ph, label, (N) Nitrogen, (P) Phosphorus, humidity, potassium (K), temperature, (K) Potassium, and rainfall, are all included in the CR dataset.
Pre-Processing using K-Nearest Neighbor (KNN) algorithm
The KNN algorithm is employed in this study for pre-processing, with the goal of increasing classification accuracy. The basis of the learning of the NN algorithm is the comparison of the particular test set using similar training sets. KNN is regarded as a SL (Supervised Learning) method by which training sets are employed to help classify points for a specific category.
Consider the set of data points (Xi, Ci), where i = 1, 2..., n. Feature values are denoted by Xi, while labels for each i are indicated by the Ci. Through the n features, the training tuples can be defined. A point in an n-dimensional space is represented by each tuple.(13) A KNN classifier looks through the pattern space for the k training tuples which are similar to the unknown tuple once it is supplied. The unknown tuples' k "NNs" are these k training tuples. The closest distance among the features is estimated using the Chebyshev distance value, expressed as follows.
![]()
It indicates the data array's maximum coordinate difference. Here y and x represent dataset features
Algorithm 1: KNN
Input: Original crop recommendation dataset with climate parameters
Output: Pre-processed dataset
Start
{
For all input features crop recommendation dataset do
Compute the Chebyshev distance using (1)
End for
Determine the K training instance which are closest the unknown class instance
Fill the error and missing values then replace it by KNN values
The instances are sorted to the closest neighbor based on distance
Choose the most commonly occurring K instance values
}
End
Attribute selection through Levy flight Grey Wolf Optimization (LGWO) algorithm
The LGWO algorithm is applied in this researchfor selecting more substantial and appropriate features through FS. The GWO algorithm is a cutting-edge swarm intelligence system,may mimic the social structure and hunting strategy of real-world grey wolves. The solution with the highest fitness is designated as alpha in order to quantitatively replicate the socially dominant hierarchy of wolves. The best fitness -2nd and 3rd solutions are designated as β and δ, correspondingly. The residual solutions are regarded as ω. The best compromises among the objective function are viewed by using the LGWO to get an array of optimal solutions, or features.
The GWO’s encircling process is taken up by LGWO; the solutions are surrounded by a neighborhood that appears like a circle and may extend to higher dimensions[14]. Contestant solutions with different random radii and hyperspheres are made possible by the random parameters D and B. It uses the same hunting process as GWO, with the search mediator allowed to determine the prey's likely location. With the adaptable values of d and D, searching and application are provided. The efficient conversion between searching and exploitation is made possible by the adaptive parameters d and D of LGWO. As a result, LGWO convergence is maintained. As D decreases, development (|D|<1) takes up half of the iterations, while exploration (|D|≥1) occupies the remaining portion. Only two essential factors need to be changed (d and B). The diversity of the records is maintained throughout optimization in this part on the selected leader and procedure. As an outcome, it is efficiently employed to produce more features for the dataset.(15)
Hunting is supervised by α, β, and wolves in this system, and ω wolves are responsible for encircling the target to show enhanced resolution. The αleads the chase. The β, and may also occasionally engage in hunting. To put it another way, α, β, and compute the area around the prey's position, an/d other wolves occasionally report their own nearby locations.
The grey wolves end the chase by confronting the target when it begins to stop moving, as mentioned before. It lowers the value of d to accurately model reaching the prey. The following is a mathematical representation of hunting behaviour:
![]()
The location of the grey wolf (features) at iteration m is represented by Y(m), the prey's location is denoted as Yk. Equations (2), and (3) are employed to compute the coefficient vectors and in this way.
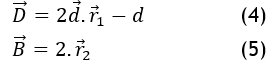
Where r1, r2 are random values within [0, 1] and the coefficient vector , decreases gradually from 2 to 0 with a greater amount of iterations.
It gives information on α, β, and δ, as well as the approximate span at the present location. The final location of the wolves is found following the computation of distances. To get the best features, it is utilized to optimize the feature settings. Throughput is enhanced and the optimal fitness values are selected. Nevertheless, it presents computational difficulties and has problems with the best FS. The LGWO algorithm is presented in this study to enhance features and lower computing complexity in order to address the previously mentioned issue.
Levy flight is employed in this context to generate outcomes that are more effective. This method uses a more effective search according to Levy flight to avoid being caught in a local optimum while the GWO is unable to obtain the optimal results after a predetermined number of repetitions. Levy flight search improves both local and worldwide search capabilities at the same tim. A Lévy flight is a random walk in which the step-lengths have a stable distributione. A set of random procedures known as Levy flights have leap sizes that correspond to the Levy probability distribution function.(16) This is a formula of standard power-law distribution.
![]()
An index is defined as 0<β≤2. A basic mathematical explanation of the Levy distribution can be expressed as.
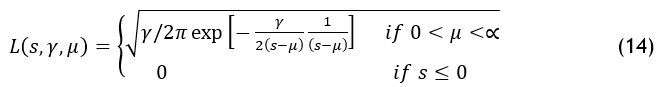
Here the collection of samples in this distribution is denoted by s , the scale parameter governs the distribution's scale, and μ stands for shift parameter or position. This component concurrently enhances local and global search performance.
In the next step, the wolves α, β, and δ, as well as ω, are marked. Involving hunting, attacking, and surrounding the target. Until the algorithm's output remains unchanged after a predetermined number of iterations and it is referred as a limiting value, this procedure is repeated. These wolves are being dispersed around the search area as a result of the Levy flight being utilized to carry out the search at this point.
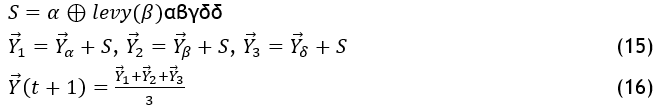
This hunting and exploitation behaviour serves as the foundation for the multi-objective GWO's formulation. is a crucial element in the Levy flight. As, an arbitrary number among 0 and 2 is generated for every wolf in the solution. Various values of lead to distinct outcomes. Greater jumps are caused by small values of , whereas smaller jumps are caused by large values of . Stated differently, greater values of are more likely to result in jumps to uncharted territory (increased exploration) and avoid becoming trapped in local optimal situations. On the other hand, new positions close to the found solutions (greater exploitation) are triggered by small values of. The LGWO is well-known for having excellent worldwide search capabilities.
Algorithm 2: LGWO for optimal FS
Input: Pre-processed dataset
Output: Optimal features with higher classifier accuracy
Start
Initialize the number of available features (i=1,2,.,n), set general input parameters and stopping criterion (crop recommendation dataset)
Initialize a, A and C (coeffic vec)
Calculate the fitness function (accuracy of the features) based on the humidity, temperature, k, pH, rainfall and N
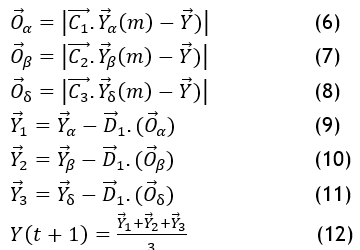
O_α- the rules with the first maximum fitness using (6)
O_β- the rules with the second maximum fitness using (7)
O_δ -the rules with the third maximum fitness using (8)
while ({\displaystyle t} t< Max number of iterations)
{
for each search agent
{
Update the position of the current search agent using (12)
end for
}
Update {\displaystyle a}d,{\displaystyle A}aA D ⃗ and B ⃗
Calculate the fitness of all available features
Calculate the new position of each wolf using the Levy flight using (15) & (16)
Update O_α,O_β{\displaystyle X_{\alpha }} {\displaystyle X_{\beta }}, and O_δ{\displaystyle X_{\delta }}
Update the solutions
t=t+1
end while
}
Return {\displaystyle X_{\alpha }}the best optimal features
End
By using first, second and third best fitness values, the most important climate features are selected. Based on the position of grey wolves, the crop based features are updated. Levy flight is used to improve the convergence speed and local optimal feature values for the given climate dataset considerably. LGWO algorithm selects the more relevant and significant features as phosphorus (P), nitrogen (N), potassium (K) and temperature.
Classification using Weight based Support Vector Machine (WSVM) algorithm
The Weight-SVM (WSVM) technique is employed in this study to perform classification. Searching for a linear separation hyperplane with the maximum margin for separating data in a higher dimensional space is the goal of this efficient ML method for data classification. The training duration of the standard SVM method is lengthy. Hence, WSVM is offered as a solution to the problem.
A decline in agricultural productivity will have an impact on the economy as a whole, as agriculture has been essential to progress. Sustainability also necessitates the appropriate management of numerous resources, including soil, seed, water, and fertilizers. Temperature and light intensity have an impact on the fruit's color, fruit-sets, and nutritional content. Crops are highly vulnerable to infections brought on by bacteria, viruses, and fungi. Pests that harm plants have an impact on both the quantity and the quality of agricultural goods.(17) Plant diseases must be manually identified, which takes time and produces inaccurate findings. Farmers' health will be impacted by prolonged pesticide exposure. The health problems associated with farmers will decrease with the automatic detection of pesticides.
The WSVM attains a separation level that is almost optimal in terms of class separation. Information could bedetachedwith nonlinear rules can be separated via geometry, and linear algebra in the high dimensional feature space that WSVM automatically embeds information into. It optimizes the distance of either class from its hyperplane and utilizes the hyperplane for separating the greatest percentage of training information on the similar class.(18) Several kernel functions that enable inner products directly in feature space are used by WSVM for this purpose. In this work, the WSVM is trained to execute dataset classification utilizing the obtained attributes. Generally, the WSVM creates a hyperplane to divide the high-dimensional space. The WSVM classifier uses the labelled vector of displacements for every VM cost and time as input to create an algorithm of the training information, which is then utilized to dynamically categorize displacements of unknown information. The training dataset model is used in the testing procedure. Having larger amounts of information, WSVM classifiers, also known as maximal margin hyper plane classifiers, show strong classification outcomes for training sets. The SVM algorithm's structure is depicted in figure 3.
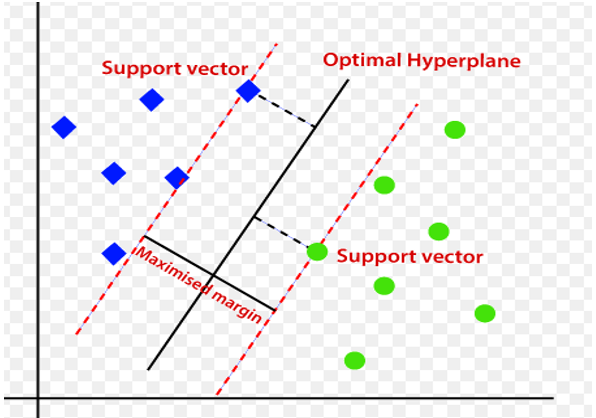
Figure 3. Structure of SVM algorithm
Besides, the resulting list has been manually enriched with the plants that produce the crop. The resulting resource is a file with a list of pairs relating each crop with the plant producing it. The WSVM is utilized to find the symptoms linked to each pair. Certainly, for each pair elaborated from the user input, the analyzer tries to find instances of the class “Symptom” matching with such a pair. If a match is found, then the instances of “Pest” related to such an instance of “Symptom” are automatically selected as a candidate to be put in the pests’ recommendation list.(19,20)
The fundamental principle of WSVM is to provide every data point a unique weight according to the significance in the class, such that various data points contribute in a different way to the decision surface's learning.(18) Assuming that the weights are assigned, the training dataset turns into:
![]()
here the scalar 0≤Wi≤1 is the weight allocated to data point
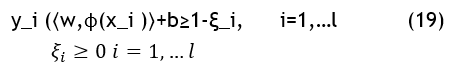
The WSVM seeks to improve the margin of separation and lessen the classification error, accuracy, and time in order to obtain strong generalization ability, beginning with the development of a cost function. Throughout the training process, all training data points are given the same weight (C), and WSVM uses a penalty term to balance out the impact of less significant data points. The issue of limited optimization is expressed as
![]()
where A is accuracy, T is time and E is error rate.
In the formulation above, it gives the data point in the weight. Thus, the two-fold formulation turns into
![]()
The upper bounds of in SVM are constrained by a constant, whereas in WSVM, they are constrained by dynamical boundaries represented by weight values . With the help of SVM weight values, it focuses on comprehending the pattern of plant pest and efficiently enhances crop productivity.
Algorithm 3: WSVM for pest classification and crop recommendation
Input: selected features (Soil, temperature, rainfall, location, soil condition and humidity)
Output: accurate crop recommendation results
Begin
{
Obtain the input samples
Apply WSVM training and testing process
Find the weather condition
Select features via LGWO
Do {
Find the pest of the plant
Check the rainfall and humidity
Compute classifier accuracy using (18) and (20)
reduce the error rate and increase the accuracy of crop features
Return higher classification result of crop recommendation
}
}
Stop
The algorithm 3 decribes how the selected features are recommendted for suitable crops. Initially, training and testing process is started by using WSVM via optimal hyperplane. It provides maximal marigin regions for support vectorrs (crop features) along with weight values. In order for the finished product to be more fruitful and free of chemicals due to the utilization of the minimum quantity of pesticides that the government prescribes.
Experimental result
The CR dataset utilized in this study was sourced from https://www.kaggle.com/siddharthss/crop-recommendation-dataset. In this research, the classification efficiency of the current ANN, IDCSO-WLSTM, and FLSOSA-ECNN is evaluated using MATLAB. By precision, execution time, recall, and accuracy, the suggested LGWO-WSVM performs in comparison to the current ANN, IDCSO-WLSTM, and FLSOSA-ECNN classification for CRS. Table 1 compares the present and suggested systems by values.
|
Table 1. Comparison values for present and suggested system |
||||
|
Methods/Metrics |
Ann (%) |
Idcso-Wlstm (%) |
Flsosa-Ecnn (%) |
Lgwo-Wsvm |
|
Accuracy |
87,71 |
92,68 |
95,36 |
97,97 |
|
Precision |
82,06 |
90,88 |
94,41 |
95,65 |
|
Recall |
84,78 |
91,98 |
95,36 |
96,77 |
|
Execution time (sec) |
250,47 |
241,0484 |
129,01 |
112,31 |
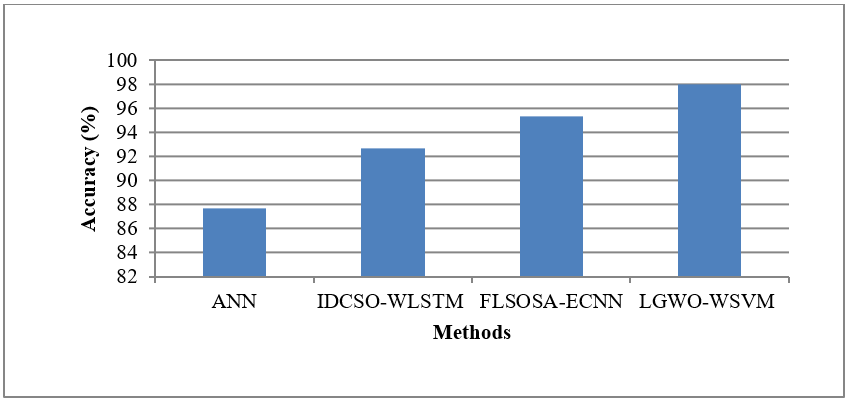
Figure 4. Accuracy
The assessment is attainedby utilizing the standard and recommended approaches by accuracy, appears in figure 4 above. The methods are represented on the x-axis, and the accuracy rate is marked on the y-axis. For the given CR dataset, the suggested LGWO-WSVM algorithm delivers more accuracy than the previous methods, such as ANN, IDCSO-WLSTM, and FLSOSA-ECNN algorithms, which provide lesser accuracy. Using the KNN technique, pre-processing is employed to enhance the pest classification’s accuracy. The key meteorological characteristics are improved for increased agricultural productivity by the suggested LGWO-FS. Thus, outcomes indicate that by carefully choosing climate features, the suggested LGWO-WSVM improves crop prediction and pest classification accuracy.
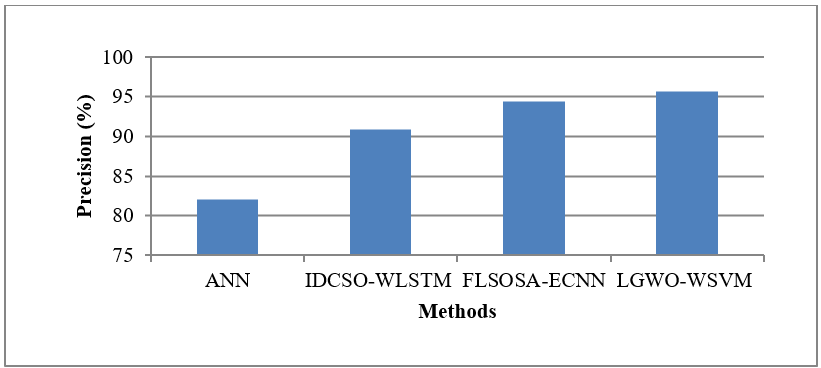
Figure 5. Precision
The performance metric is evaluated by comparing the current techniques for precision, as seen in figure 5 above. The methods are represented on the x-axis, and the rate of the precision is marked on the y-axis. While the current ANN, IDCSO-WLSTM, and FLSOSA-ECNN approaches offer lower precision, the suggested LGWO-WSVM methodology offers higher precision. The purpose of the suggested system is to narrow down the more pertinent data from several aspects of the same agricultural production. The optimal weather parameter is determined early in the cultivation process by this LGWO-WSVM method. at order to maximize productivity at the end, it can be concluded that the suggested LGWO-WSVM algorithm improves the accuracy of the useful features for CR and pest classification.
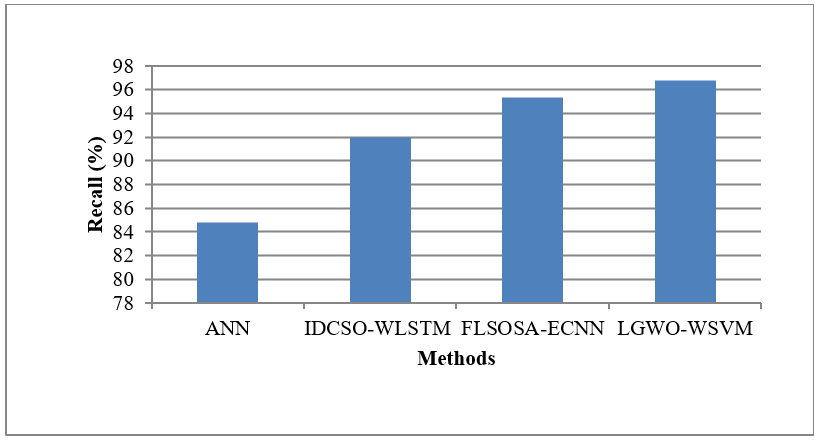
Figure 6. Recall
Recall of the performance metric is evaluatedby comparing the current techniques, appears in the above figure 6. The tactics are represented on the x-axis, while the recall rate is plotted on the y-axis. While the ANN, IDCSO-WLSTM, and FLSOSA-ECNN techniques currently in use offer lesser recall, the suggested LGWO-WSVM algorithm offers higher recall. The purpose of the suggested system is to narrow down the more pertinent data from several aspects of the same agricultural production. The suggested LGWO-WSVM method uses meteorological characteristics to assist increase agricultural productivity. Thus, the outcome indicates that the suggested LGWO-WSVM technique improves the accuracy of the useful features for the CR procedure.
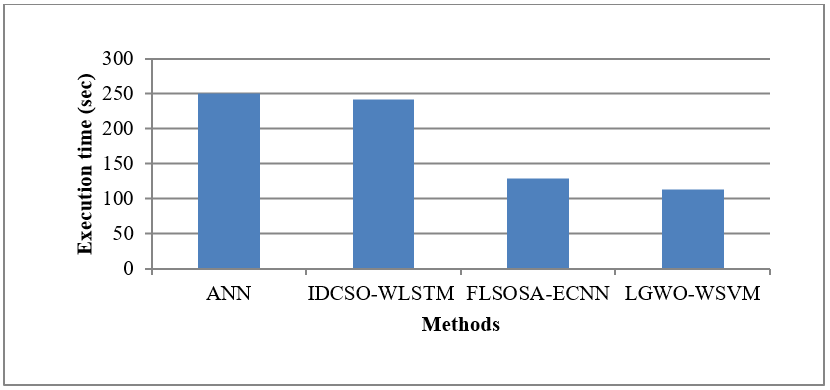
Figure 7. Execution time
It is evident from figure 7 above that the performance metric is evaluated by comparing the execution time of the previous and suggestedapproaches. The approaches are represented on x-axis, the execution rate is marked on the y-axis. For the given CR dataset, the suggested LGWO-WSVM system has a lesser time of execution than the previousmethods, like ANN, IDCSO-WLSTM, and FLSOSA-ECNN algorithms, which have greater execution times. Consequently, outcomes indicate that the suggested LGWO-WSVM progresses crop prediction accuracy through choosing climate attributes optimally.
CONCLUSION
The idea of this study is to offer the LGWO-WSVM algorithm to enhance the CRS's performances for the climatic dataset. Three primary parts, including pre-processing, FS, and classification, make up this study. The goal of pre-processing is to handle missing values forimproving the dataset quality. Utilizing the LGWO method, which effectively chooses the best weather features, the features are chosen. Then, for applications in real time, the LGWO algorithm offers the pertinent and helpful characteristic. Lastly, the WSVM method, which offers more accurate prediction efficiency, is used in the process of classification. The suggested LGWO-WSVM paradigm contributes to increased agricultural productivity. The suggested LGWO-WSVM algorithm outperforms the current algorithms by time complexity, precision, recall, and accuracy, according to the testing results. By using DL techniques, it will be possible to recommend fertilizers for the land and pesticides for the chosen crop in future work.
REFERENCES
1. Pudumalar S, Ramanujam E, Rajashree RH, Kavya C, Kiruthika T, and Nisha J. Crop recommendation system for precision agriculture. In eighth international conference on advanced computing (ICoAC), pp. 32-36. https://doi.org/10.1109/ICoAC.2017.7951740.
2. Maneesha A, Suresh C, and Kiranmayee BV. Prediction of rice plant diseases based on soil and weather conditions. In Proceedings of International Conference on Advances in Computer Engineering and Communication Systems, pp. 155-165.https://doi.org/10.1007/978-981-15-9293-5_14.
3. Nevavuori P, Narra N, and Lipping T. Crop yield prediction with deep convolutional neural networks. Computers and electronics in agriculture, 163, pp.104859. https://doi.org/10.1016/j.compag.2019.104859.
4. Lacasta J, Lopez-Pellicer FJ, Espejo-García B, Nogueras-Iso J, and Zarazaga-Soria FJ. Agricultural recommendation system for crop protection. Computers and Electronics in Agriculture, 152, pp.82-89. https://doi.org/10.1016/j.compag.2018.06.049.
5. Pawar M, and Chillarge G.Soil toxicity prediction and recommendation system using data mining in precision agriculture. In 3rd international conference for convergence in technology (I2CT), pp. 1-5. https://doi.org/10.1109/I2CT.2018.8529754.
6. Kulkarni NH, Srinivasan GN, Sagar BM, and Cauvery NK. Improving crop productivity through a crop recommendation system using ensembling technique. In3rd international conference on computational systems and information technology for sustainable solutions (CSITSS), pp. 114-119. https://doi.org/10.1109/CSITSS.2018.8768790.
7. Modi D, Sutagundar AV, YalavigiV, and Aravatagimath A. Crop recommendation using machine learning algorithm. In 5th International Conference on Information Systems and Computer Networks (ISCON), pp. 1-5. https://doi.org/10.1109/ISCON52037.2021.9702392.
8. Pant J, Pant RP, Singh MK, Singh DP, and Pant H. Analysis of agricultural crop yield prediction using statistical techniques of machine learning. Materials Today: Proceedings, 46, pp.10922-10926. https://doi.org/10.1016/j.matpr.2021.01.948.
9. Gandhi N, Armstrong LJ, Petkar O, and Tripathy AK. Rice crop yield prediction in India using support vector machines. In13th International Joint Conference on Computer Science and Software Engineering (JCSSE), pp. 1-5. https://doi.org/10.1109/JCSSE.2016.7748856.
10. Xie C, Wang R, Zhang J, Chen P, Dong W, Li R, Chen T, and Chen H. Multi-level learning features for automatic classification of field crop pests. Computers and Electronics in Agriculture, 152, pp.233-241. https://doi.org/10.1016/j.compag.2018.07.014.
11. Ullah N, Khan JA, Alharbi LA, Raza A, Khan W, and Ahmad I. An efficient approach for crops pests recognition and classification based on novel deeppestnet deep learning model. IEEE Access, 10, pp.73019-73032. https://doi.org/10.1109/ACCESS.2022.3189676.
12. Gupta S, Geetha A, Sankaran KS, Zamani AS, Ritonga M, Raj R, Ray S, and Mohammed HS. Machine learning-and feature selection-enabled framework for accurate crop yield prediction. Journal of Food Quality, pp.1-7. https://doi.org/10.1155/2022/6293985.
13. Kuhkan M. A method to improve the accuracy of k-nearest neighbor algorithm. International Journal of Computer Engineering and Information Technology, 8(6), pp.90-95.
14. Tripathi AK, Sharma K, and Bala M. A novel clustering method using enhanced grey wolf optimizer and mapreduce. Big data research, 14, pp.93-100. https://doi.org/10.1016/j.bdr.2018.05.002.
15. Ren, Y., Shi, G., & Sun, W. (2023). Annual forecasting of high‐temperature days in China through grey wolf optimization‐based support vector machine ensemble. International Journal of Climatology, 43(6), 2521-2540.
16. Chen, Yehua, et al. "Grey wolf optimization algorithm based on dynamically adjusting inertial weight and levy flight strategy." Evolutionary Intelligence 16.3 (2023): 917-927.
17. Rustam Z, Pandelaki J, and Siahaan A. Kernel spherical k-means and support vector machine for acute sinusitis classification. In IOP Conference Series: Materials Science and Engineering, 546(5), pp. 052011. https://iopscience.iop.org/article/10.1088/1757-899X/546/5/052011/meta#:~:text=DOI%2010.1088/1757%2D899X/546/5/052011.
18. Hasan, Md Jahid, et al. "Rice disease identification and classification by integrating support vector machine with deep convolutional neural network." 2019 1st international conference on advances in science, engineering and robotics technology (ICASERT). IEEE, 2019.
19. Rodríguez-García, Miguel Ángel, Francisco García-Sánchez, and Rafael Valencia-García. "Knowledge-based system for crop pests and diseases recognition." Electronics 10.8 (2021): 905.
20. Coulibaly, Solemane, et al. "Explainable deep convolutional neural networks for insect pest recognition." Journal of Cleaner Production 371 (2022): 133638.
FINANCING
"The authors did not receive financing for the development of this research".
CONFLICT OF INTEREST
"The authors declare that there is no conflict of interest".
AUTHORSHIP CONTRIBUTION
Conceptualization: S. Kiruthika.
Data curation: D.Karthika.
Formal analysis: D.Karthika.
Research: S. Kiruthika.
Methodology: D.Karthika.
Drafting - original draft: S. Kiruthika.
Writing - proofreading and editing: S. Kiruthika.